3.1 Building conceptual models of causal pathways
The conceptual model of causal pathways describes how the bioregion or subregion works and how it might respond to coal resource development. It is a collection of narratives, diagrams, graphics, hypotheses and supporting evidence base. It will not typically exist as a single conceptual model, but rather as a set of nested conceptual models that focus on certain parts of the bioregion or subregion or portray alternative conceptualisations or hypotheses about the systems.
The causal pathways are identified for the baseline coal resource development (baseline) and the coal resource development pathway (CRDP). Coal resource development is already a considerable part of the baseline in many locations (e.g. the Hunter subregion) while in others there has been no development as of January 2016 (e.g. Galilee subregion). The causal pathways identified for the CRDP will also often be an augmentation of causal pathways for the baseline.
The focus here is primarily on the causal pathways leading from the coal resource development to the hydrological changes (represented by the hydrological response variables). Potentially impacted landscape classes and ecosystems are identified and described in the conceptual model of causal pathways, but these landscape classes and their dependencies are not examined in detail until the receptor impact modelling (product 2.7), and then only for those landscape classes that are likely to be impacted.
While it will be important for final versions of the groundwater and surface water models to be fully cognisant of these causal pathways and include them in the modelling where possible, preliminary versions of the model will typically be available given the time required to build the models. The preliminary model results can focus effort on the parts of the preliminary assessment extent (PAE) that are likely to be impacted – and minimise effort in parts that are unlikely to be impacted. This is emphasised in Figure 4 where the conceptual model of causal pathways sits between boxes with the preliminary and final results for hydrological modelling (which identifies locations of potential hydrological impact).
Figure 8 summarises how to build the conceptual model of causal pathways. It emphasises the need to describe the key geological, hydrogeological and hydrological systems, components and processes in the bioregion or subregion (steps 1 to 3). This is supplemented by a landscape classification of ecosystems, both natural and human dominated, at the surface (step 4). The baseline and CRDP are then determined, and the known water management rules for these summarised (step 5), noting that the difference in results between baseline and CRDP is the primary change assessed in a BA for a given bioregion or subregion. Steps 6 and 7 are the key steps in the conceptual model of causal pathways and begin with a hazard analysis to identify possible changes resulting from coal resource development. The hazards identified can be subsequently aggregated to a set of main causal pathways. Step 8 summarises the causal pathways for baseline and CRDP, from coal resource development to impacts on water and water-dependent assets. The next four subsections provide a richer description of these eight steps.
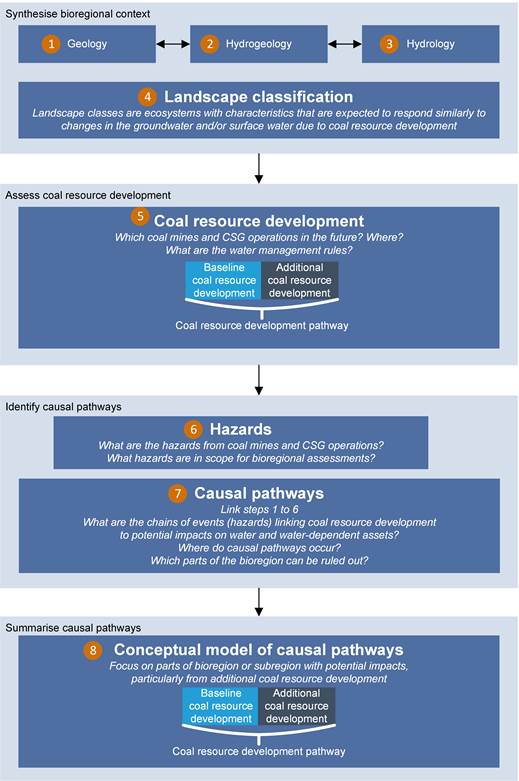
Figure 8 Building the conceptual model of causal pathways
The orange circles indicate the number of the steps referred to in the text. The coal resource developments in the coal resource development pathway (CRDP) are the sum of those in the baseline coal resource development (baseline) and the additional coal resource development (ACRD).
3.1.1 Steps 1 to 4: synthesise bioregional context
The conceptual model of causal pathways needs to describe the key system components, processes and interactions of a bioregion or subregion. The spatio-temporal boundaries of the conceptual model are defined on the basis of the PAE and CRDP. It is reasonable to focus on a smaller area within the PAE if the CRDP localises the area of interest.
3.1.1.1 Geology, hydrogeology and hydrology
The conceptual model of causal pathways summarises the system knowledge and understanding about the geology, hydrogeology and surface water hydrology, including the water balance. It builds on the contextual information from Component 1: Contextual information – particularly the context statement (product 1.1), coal and CSG resource assessment (product 1.2), current water accounts and water quality (product 1.5) and water balance assessment (product 2.5). When describing the conceptual model of causal pathways in product 2.3 (conceptual modelling), the focus is on aspects that might affect hydrological change and thus be relevant to understanding potential pathways to impact on water-dependent assets. For instance, repeating the detailed stratigraphy and descriptions of individual layers from product 1.1 (context statement) is not necessary but it is important to describe the target coal seams, aquifers and aquitards, and those features (e.g. faults) that may otherwise affect the movement of water. Likewise, the details of the water balance are reported in product 2.5 (water balance assessment), but a summary of the dominant mechanisms and locations of recharge, discharge, flows and surface water ‒ groundwater interactions are reported in product 2.3 (conceptual modelling).
The conceptualisations of geology, hydrogeology and hydrology underpin the surface water and groundwater models within a BA. There is, however, no need to be constrained by the specifics of the model implementation. This can be framed according to the extent of available knowledge and (if relevant) specifics can be provided about a particular and possibly more limited conceptualisation that might occur through actual model development. For instance, the conceptual model of causal pathways might represent potential changes to water quality even if they are not addressed through numerical modelling, or the conceptual modelling of the geology might describe layers that fold considerably at the edges of the geological basin, while the specific model implementation may assume a series of horizontal layers.
Preliminary surface water and groundwater model outputs can provide more detailed description of areas that are potentially subject to hydrological change. Parts of the bioregion or subregion can be considered separately where helpful – for example, where coal resource developments are distant from each other and potential impacts are hydrologically disconnected, or local processes and interactions warrant a more detailed focus.
Multiple or alternative conceptualisations of system components, processes or interactions can be considered and documented as they are an important part of being transparent about the evidence base.
3.1.1.2 Landscape classification
The role and construction of a landscape classification for a bioregion or subregion is described in the companion submethodology M03 for assigning receptors to water-dependent assets (O’Grady et al., 2016). By systematically classifying geographical areas into classes that are, within limits, physically, biologically or hydrologically similar, the landscape classification enables a high-level conceptualisation of the bioregion or subregion at the surface – conceptualisation that is akin to the key geological, hydrogeological and hydrological systems and processes. This landscape classification, importantly, includes human ecosystems, such as rural and urban areas. The landscape classification aims to:
- reduce complexity to a limited number of landscape classes (e.g. 10 to 20) appropriate for a regional-scale assessment. These classes are mutually exclusive and comprehensive such that all assets in a BA are a member of at least one landscape class
- guide the review of conceptual models for selection of appropriate hydrological response variables and receptor impact variables associated with water-dependent assets
- aggregate at a level that is useful for reporting impacts and risks in product 3-4 (impact and risk analysis) – that is, at a broader scale than that of individual assets.
It is important to describe how landscape classification has been enacted for each bioregion or subregion, including what data layers have been used as the basis of the classification, the aggregation that has occurred, and the final set of classes adopted to represent the key systems. There will be differences in classes across bioregions and subregions given different biophysical characteristics and existing classifications. For instance, while the Australian National Aquatic Ecosystem classification is likely to be used heavily to classify aquatic ecosystems, it is not available across all bioregions or subregions and other classifications will need to be chosen. A hybrid approach is expected: aquatic ecology will be covered by the ANAE classification or River Styles, and terrestrial or human systems covered by vegetation or land use classifications. See detail in the companion submethodology M03 (as listed in Table 1) for assigning receptors to water-dependent assets (O’Grady et al., 2016) but broadly aim for 10 to 20 landscape classes, and fewer if possible. Landscape classes need to be tested against regional knowledge, either through one-on-one interactions with key experts or a workshop.
The process undertaken to construct these landscape classes ‒ and to document their dependence on surface water and groundwater ‒ needs to be captured and supported with an evidence base where possible. Consider representing some assets in a narrative around landscape classification to provide important context for the reader ‒ for example, describing key matters of national ecological significance that sit within a specific landscape class (e.g. communities and species listed under the Commonwealth’s Environment Protection and Biodiversity Conservation Act 1999).
Detailed conceptual models for landscape classes are not required at this stage. They will only be examined through the receptor impact modelling (product 2.7) and impact and risk analysis (product 3-4) if the landscape classes are potentially impacted by coal resource development.
3.1.2 Step 5: assess coal resource development
At the heart of a BA is a comparison of two potential futures, the baseline and the CRDP. These two futures play a critical role in the conceptual model of causal pathways because it is activities associated with coal resource developments in these futures that initiate or modify pathways to impact on water-dependent assets.
3.1.2.1 Developing the coal resource development pathway
The CRDP is clearly presented and justified in product 2.3 (conceptual modelling) for each bioregion or subregion. This product builds upon the information outlined in the catalogue of potential coal resource developments contained in each companion product 1.2 (coal and coal seam gas resource assessment). The process for determining the CRDP is explained in detail in the companion submethodology M04 for developing a CRDP (Lewis, 2014). Consequently, the information presented here focuses on the requirements for reporting the CRDP in product 2.3 (conceptual modelling), and guides Assessment teams to deliver consistent content across different bioregions and subregions.
Assessment teams must critically evaluate available data and information about each coal resource development to determine if it will be included in the CRDP (Lewis, 2014). The two most important criteria are each project’s:
- statutory approvals status, especially the stage of its environmental impact statement (EIS) assessment
- classification level in the Australian National Resource Classification Scheme, in particular, the identification of an economically demonstrated resource (EDR).
However, as explained in submethodology M04, other coal or CSG projects that are not yet at the stage of EIS assessment, or do not have a current EDR, can also be included (or excluded) in the CRDP if sufficient evidence is available (Lewis, 2014). The proposed CRDP is independently evaluated with relevant mining and development companies, state government agencies and other external experts as required.
3.1.2.2 Main reporting requirements
The CRDP reported in product 2.3 (conceptual modelling) for each bioregion or subregion describes and justifies the choice of:
- baseline coal mines and CSG fields that were commercially producing as of December 2012
- those that are expected to be commercially producing after December 2012 (defined as the additional coal resource development)
- those that have been excluded from the CRDP.
Note that the coal resource developments in the CRDP are the sum of those in the baseline and the additional coal resource development.
The availability and quality of data are assessed for all coal resource developments so that a decision can be made whether they are explicitly modelled or (alternatively) assessed through qualitative methods such as commentary.
The CRDP is best reported with a brief description that includes the main features of each operation, including the name, type, owner, status and expected operational timelines. It should also explicitly recognise that the evaluation is based on the data and information available to the Assessment team at the point in time of their analysis (and the month and year that the CRDP was decided should be reported here). This effectively provides a ‘time stamp’ for the CRDP, and recognises that the future roll-out of developments might differ, for example, due to unexpected variations in commodity prices or changes in extraction technology. The following description provides an example[1]:
The coal resource developments in the coal resource development pathway (CRDP) for the X subregion are the sum of those in the baseline coal resource development (baseline) and in the additional coal resource development (ACRD), based on data and information available to the Assessment team in October 2015. The baseline includes three open-cut coal mines (include names here) but no CSG operations. The CRDP includes the coal resource developments in the baseline, plus three new open-cut coal mines (include the names of the proposed mines here), two new underground longwall coal mines (include names here) and one coal seam gas (CSG) operation (include name here). The distribution and characteristics of these developments are shown in the map in Figure A. Figure B shows the most likely timeline as each of these development stages becomes operational, and this timeline will be used when undertaking the surface water and groundwater modelling in the bioregional assessment. Future development operations are expected to involve this, that and the other (to be qualified to the extent possible based on available information). While there are a few other resource projects with economically demonstrated and inferred resources that could potentially be extracted at some stage in the future, these were not included in the CRDP for the following reasons…. A summary of the operations in the baseline and CRDP for this subregion is shown in Table A.
This brief description should be supported by relevant detailed information in an accompanying table. An example is shown in Table 3. It is also important to include a map for spatial context. The map can also be used to display other relevant information about each site, such as proposed extraction rates, projected start and end dates, and expected mining methods. Additionally, to capture the progression in time of coal resource development, a timeline diagram (similar to a Gantt chart) is recommended to show the lifespan (and main stages, if possible) of coal resource development (see an example in Figure 9).
3.1.2.3 Other reporting requirements
In many bioregions and subregions, coal resource development in the CRDP will be incorporated as part of subsequent numerical modelling for the BAs, for example, to evaluate proposed mine development impacts on groundwater flow systems. However, companion submethodology M04 (Lewis, 2014) recognises that there might be insufficient data available to realistically incorporate some projects in surface water and groundwater modelling. Instead, it might be possible to only undertake semi-quantitative analysis or qualitative commentary as part of the subsequent BA. Consequently, it is important to specify in product 2.3 (conceptual modelling) which projects in the baseline and CRDP are expected to be modelled, and which may only be assessed through commentary. This is done in the exemplar Table 3.
Table 3 Example table: existing operations and proposed developments in the baseline and coal resource development pathway for the Gloucester subregion as at October 2015
Example only; do not use for analysis. This is an early draft of a table published in Dawes et al. (2016). See Dawes et al. (2016) for full explanation and interpretation of the final results, which might vary from that shown here.
The primary activity in bioregional assessments (BAs) is the comparison of two potential futures: (i) the baseline coal resource development (baseline), a future that includes all coal mines and coal seam gas (CSG) fields that are commercially producing as of December 2012; and (ii) the coal resource development pathway (CRDP), a future that includes all coal mines and CSG fields that are in the baseline as well as those that are expected to begin commercial production after December 2012. The difference in results between CRDP and baseline is the change that is primarily reported in a BA. This change is due to the additional coal resource development – all coal mines and CSG fields, including expansions of baseline operations, that are expected to begin commercial production after December 2012.
|
Name of existing operation or proposed development |
Coal mine or coal seam gas (CSG) operation |
Company |
Included in baseline? |
Included in coal resource development pathway (CRDP)? |
Start of mining operations or estimated project start |
Projected mine life or estimated project life |
Tenement(s) |
Total coal resources (Mt)a (for coal mining) or 2Pb gas reserves (for CSG) (PJ) |
Comments |
|---|---|---|---|---|---|---|---|---|---|
|
Duralie Coal Mine |
Open-cut coal mine |
Yancoal Australia Ltd |
Yes |
Yes – model |
2003 |
2017 |
ML 1427 |
148c |
None needed |
|
Duralie Coal Mine expansion |
Open-cut coal mine |
Yancoal Australia Ltd |
No |
Yes – model |
2013 |
2024 |
ML 1427,ML A1 |
8.9c |
Expansion approved by NSW Land and Environment Court, November 2011 |
|
Stratford Mining Complex |
Open-cut coal mine |
Yancoal Australia Ltd |
Yes |
Yes – model |
1995 |
2026 |
ML 1360, ML 1409, ML 1447, ML 1521,ML 1538, ML 1577, ML 1528 |
98c |
None needed |
|
Stratford Mining Complex expansion |
Open-cut coal mine |
Yancoal Australia Ltd |
No |
Yes – model |
2015 |
2026 |
ML 1360, ML 1409, ML1447, ML 1521, ML 1528, ML 1538, ML 1577, EL 6904, EL 311, EL 315 |
24.15c |
Extension approved by NSW Planning Assessment Commission, May 2015 |
|
Rocky Hill Coal Project |
Open-cut coal mine |
Gloucester Resources |
No |
Yes – model |
2016? If approval granted |
2037 |
EL 6523, EL 6524, EL 6563 |
25c |
On hold by NSW Government, as at June 2015 |
|
Gloucester Gas Project stage 1 |
CSG |
AGL |
No |
Yes – model |
2016 |
15–25 years (depending on the extent of the CSG resources) |
PEL 285 |
454b for Gloucester Basin exploration to December 2013 |
Waukivory Pilot Project approved by NSW Government August 2014. AGL final investment decision expected late 2015 |
|
Gloucester Gas Project stage 2 and beyond |
CSG |
AGL |
No |
Yes – commentary |
Unknown (as at June 2015) |
Unknown (as at June 2015) |
PEL 285 |
Included in 454c for Gloucester Basin exploration to December 2013 |
Conceptual only as at June 2015. Mainly west and south of stage 1 |
aIndicates the different resource classes that may combine to form the total resource tonnage – typically these are reported in accordance with the Joint Ore Reserves Committee (JORC) Code. For example, the different JORC resource classes of measured, indicated and inferred resources could be shown (or whichever combination of resource classes is applicable for each project).
bProved plus probable reserves
cResource figure is for the entire life of the project.
EL = exploration licence; PEL = petroleum exploration licence; ML = mining lease
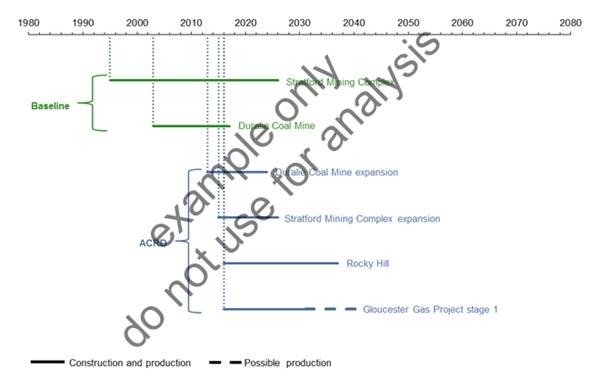
Figure 9 Example diagram: timelines for coal and coal seam gas developments in the Gloucester subregion
Example only; do not use for analysis. This is an early draft of a figure published in Dawes et al. (2016). See Dawes et al. (2016) for full explanation and interpretation of the final results, which might vary from that shown here.
These timelines were used in the hydrological modelling for the bioregional assessment of the Gloucester subregion in 2015. It should be noted that in November 2015, the Rocky Hill development was on hold with the NSW Government and AGL’s Stage 1 gas field development area awaited a final investment decision by AGL.
The coal resource developments in the CRDP are equal to the sum of those in the baseline and ACRD.
Baseline = baseline coal resource development, a future that includes all coal mines and coal seam gas (CSG) fields that were commercially producing under an operations plan approved as of December 2012
CRDP = coal resource development pathway, a future that includes all coal mines and coal seam gas (CSG) fields that are in the baseline as well as those that are expected to begin commercial production after December 2012
ACRD = additional coal resource development, all coal mines and coal seam gas fields, including expansion of baseline operations, that are expected to begin commercial production after December 2012.
3.1.2.3.1 Coal resource developments excluded from the coal resource development pathway
An equally important part of product 2.3 (conceptual modelling) is to explicitly recognise if there are any coal resource developments that were initially in the catalogue of potential resource developments (Section 1.2.4 of product 1.2 (coal and coal seam gas resource assessment)), but have subsequently been excluded from the CRDP. The reasons for excluding such projects should be clearly outlined and justified in product 2.3 (conceptual modelling). As discussed in companion submethodology M04 (Lewis, 2014), for BA purposes, there may be various reasons to exclude a potential resource project from the CRDP, for example economic or legislative factors, statutory conditions, etc. In general, the known coal or CSG deposits that are most likely to be excluded from the CRDP are those that are currently not well defined nor sufficiently advanced in terms of current understanding of the geological characteristics or the viable extraction options. These are commonly classified as either sub-economic demonstrated resources or inferred resources in the Australian National Resource Classification Scheme (Geoscience Australia, 2015).
Even though a coal resource development might be excluded from the CRDP based on current evidence, this does not mean that development will not take place at some (unknown) time in the future. It simply reflects that on the basis of the current geological and economic understanding of the development potential of the known resource, the Assessment team is unable to sufficiently justify its inclusion as a ‘most likely development’ at the time of the BA. In such cases, future iterations of the BAs need to reassess and reappraise. A future updated BA might include resource projects that were deemed to not meet the necessary criteria for the current BA.
3.1.2.3.2 Information updates
As there might be considerable lengths of time between publication of the coal and coal seam gas resource assessment (product 1.2) for the bioregion or subregion, and the subsequent release of product 2.3 (conceptual modelling), Assessment teams may become aware of updates or modifications to some proposed coal resource developments. For example, this could include updated resource tonnages for specific projects (i.e. resulting from further drilling and resource characterisation studies), or variations to initial development plans. Consequently, it is useful to acknowledge if any such variations exist, and a minor part of the description of the CRDP in product 2.3 (conceptual modelling) can be used to specify any updates to information on projects initially outlined in product 1.2 (coal and coal seam gas resource assessment).
3.1.2.4 Water management for coal resource developments
It is important to describe how mine and CSG developments within the CRDP manage water extraction and disposal as part of their operations. These activities can be important to identifying hazards and potential causal pathways. The specific details of the operations for individual developments need to be considered in building the conceptual model of causal pathways – for example, the rules under which produced water is discharged to a local stream, or whether all produced water is evaporated in holding ponds, or how the water is extracted for CSG operations, or whether the water is being treated before release into surface water or aquifer. This information is provided in several products:
- Product 2.3 (conceptual modelling) includes an overall summary, either quantitative or qualitative.
- Product 2.1-2.2 (observations analysis, statistical analysis and interpolation) provides additional detail for individual coal resource developments (noting that given the large number of developments in some bioregions and subregions, only those included in the CRDP should be summarised).
- Product 2.6.1 (surface water numerical modelling) and product 2.6.2 (groundwater numerical modelling) specify how the water management rules for individual developments are implemented in the hydrological models.
Specific assumptions about mine and CSG water management will typically require access to industry data. Where it does not exist, the Assessment team will need to approximate it in order for it to be incorporated in the part of the CRDP that can be modelled. There are also river management operations that rely on unpredictable human decision making (e.g. the Hunter River Salinity Trading Scheme) that is hard to represent as a series of water management rules (e.g. discharge triggers) in numerical models.
3.1.3 Steps 6 to 7: identify causal pathways
The identification of the causal pathways is the key step in building the conceptual model of causal pathways (Figure 8). It needs to capture the logical chain of events starting from an activity associated with coal resource development to the potential change in groundwater or surface water, and the subsequent potential impact on water-dependent assets. The logic must be supported by the best available scientific knowledge, which may consist of peer-reviewed evidence through to reasoned, though untested, hypotheses. More evidence may subsequently be produced by the BA modelling and analysis.
The focus in product 2.3 (conceptual modelling) is on the first half of the causal pathway, from the coal resource development to the hydrological changes. Potentially impacted landscape classes should be identified but will not be considered in detail until the receptor impact modelling (product 2.7). This might include further refinement of the hydrological stressors identified; for example, change in flow might be identified as a hazard but the hydrological response variable in the receptor impact modelling may relate more to reduction in summer flows.
3.1.3.1 Hazard analysis
The essential role of the hazard analysis in building causal pathways is described in Chapter 1 and Section 2. 3. Submethodology M11 (Ford et al., 2016) details the systematic approach for identifying water-related hazards associated with coal mines and CSG operations. It uses the Gloucester subregion as a case study, but standalone hazard identification reports are generated for each bioregion or subregion and must be considered in building the causal pathways.
Within product 2.3 (conceptual modelling), it is necessary to: (i) outline the specific hazard analysis undertaken for the bioregion or subregion, and (ii) identify and summarise the potential effects that may result from the coal resource development and its associated water management within that bioregion or subregion. At this point there is no need to think about whether that development is included in the baseline or the CRDP.
The standalone hazard identification reports (registered as a dataset in product 2.3 (conceptual modelling)) provide a strong summary narrative and a range of key tables and figures that summarise the impact modes and water-related effects. Two summary hazard ranking scores are used: an overall hazard score based on severity and likelihood, and a hazard priority number that considers the ability to detect an impact in addition to the severity and likelihood. The top 30 hazards under each ranking score should be considered along with any other unique hazards for CSG operations, open-cut coal mines and underground coal mines separately.
Some of these top 30 hazards will likely have the same impact mode or impact cause and relate to similar activities occurring in different life-cycle stages. For instance, wells will be drilled during exploration as well as production stages and may present the pathways to impact via well integrity but with quite different severity and likelihoods given the different intensity of drilling.
Consider also those hazards that may not be ranked as highly but that occur more frequently, as they may potentially accumulate. The use of top 30 here is subjective and indicative. It will be important for the Assessment teams to consider a threshold that represents hazards that are as plausible for the bioregion or subregion. Ultimately it makes more sense to scale the attention individual hazards receive to their relative importance rather than imposing thresholds; hazards that have low scores should be acknowledged, and their potential to accumulate considered, but given much less emphasis than counterparts with high scores.
3.1.3.1.1 Hazard handling and scope
The hazard analysis generates a long list of hazards due to coal mines and CSG operations for each bioregion or subregion. BAs focus on those hazards that extend beyond the development site and that may have cumulative impacts because these are consistent with the regional focus of BAs as well as the opportunity for BAs to add value beyond site-specific EISs. However, ultimately BAs need to be able to address all identified hazards, although different approaches might be used for different hazards:
- Some hazards are outside the scope of BAs (e.g. accidents) and are not further assessed.
- Some are addressed by numerical modelling.
- Some are addressed by consulting literature and providing a narrative.
- Some hazards cannot be addressed due to science gaps, and these are noted.
The following guiding principles were considered in deciding how individual hazards are handled:
- BAs are constrained by considering only impacts that can happen via water, and so hazards such as dust, fire or noise are deemed out of scope and addressed by site-based risk management unless there is a water-mediated pathway.
- Leading practice is assumed and accidents are deemed to be covered adequately by site risk management procedures and beyond the scope of BAs, for example the failure of a pipe between the pit and a dam is covered by site risk management.
- Hazards that pertain to the development site and with no off-site impacts will typically be covered by site risk management procedures.
- The hazard priority number or hazard score indicates the relative importance of the hazard. Hazards with low numbers or scores are of lower priority and their impacts may be considered negligible or implausible.
For those hazards that are considered, some will be addressed through the numerical modelling but others can only be addressed through informed narrative. Quantitative risk statements will only be possible where modelling is undertaken. For CSG operations, some hazards will be modelled (such as aquifer depressurisation (target and non-target) or the extraction of surface water for operations); others are expected to be covered through narrative only (such as hydraulic fracturing chemicals, disruption of natural surface drainage or watercourses, changes to aquifer properties, or subsidence). Similarly, for open-cut and underground coal mines, dewatering and changes to the natural surface water drainage will be modelled, while well integrity and erosion will be addressed through narrative only.
The ability for modelling to shed light on certain hazards will depend on the model resolution. Pipelines and site infrastructure for CSG operations will typically not be at a resolution that can be addressed with BA modelling. Water quality will be narrative only, though changes in salinity will be addressed qualitatively and there is potential for particle tracking to be used as a post-processing step to assess changes. The latter will be on a case-by-case basis and depend on the modelling undertaken in the bioregion or subregion (see companion submethodology M07 (as listed in Table 1) for groundwater modelling (Crosbie et al., 2016)).
3.1.3.2 Causal pathways
At the highest level, water-dependent assets may be impacted by changes to quantity, quality or timing of surface water or groundwater or both (see Figure 10 for an example for open-cut coal mines for the Maranoa-Balonne-Condamine subregion). For surface water, the pathways to these changes may primarily come from disruption of the surface drainage (e.g. interception of runoff by the pit or storage dams, as result of subsidence or by diversion of a stream network) or the extraction of water from and disposal of water to a local stream network. From a groundwater perspective, dewatering, depressurisation and other development activities (e.g. wells) can induce pathways to change by altering groundwater levels, flows and directions, quality, preferential pathways and inter-aquifer connectivity. Surface water ‒ groundwater interactions might also change, either by altering recharge from the stream network or as reduced baseflow from the deeper groundwater to the streams. Additional causal pathways also follow on from some of these. For instance, changes to surface water flow due to a mine’s interception of runoff may alter the connectivity of a wetland to a river.
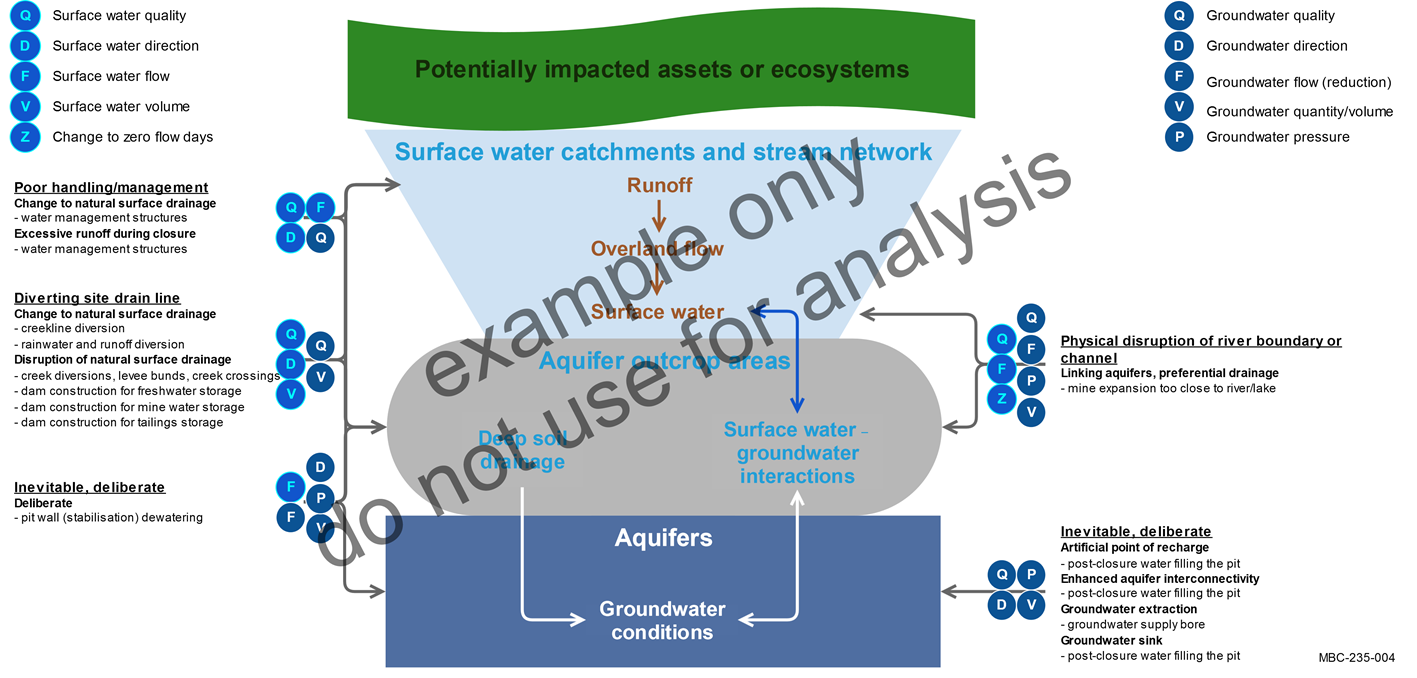
Figure 10 Example diagram: hazards (impact causes, impact modes and activities) and associated effects identified for the life-cycle stages of open-cut coal mines that are considered to be in scope in the Maranoa-Balonne-Condamine subregion
Example only; do not use for analysis. This is an early draft of a diagram published in Holland et al. (2016). See Holland et al. (2016) for full explanation and interpretation of the final results, which might vary from that shown here.
Impact causes are underlined, impact modes are bold and activities are bullet points. Arrows indicate the spatial context for each hazard: aquifers, aquifer outcrop areas, watercourses, catchments. Hydrological effects to system components may cause potential impacts to assets or ecosystems that rely on surface water and/or groundwater. Hydrological effects are denoted by the round circles, where the light blue circles represent surface water hydrological effects and the dark blue circles represent groundwater hydrological effects. The system components are represented by the light blue triangle, grey oval and dark blue rectangle.
GDEs = groundwater-dependent ecosystems
Typology and punctuation are consistent with the hazard analysis (Bioregional Assessment Programme, Dataset 1).
While these high-level causal pathways are important for concentrating effort and communicating the science, more detail and structure needs to be provided at finer levels of resolution. The hazard analysis identifies a long list of potential impacts that might occur due to CSG operations and coal mines. For CSG operations and open-cut coal mines in the Gloucester subregion, over 600 potential individual hazards (impact modes) were identified, along with impact causes (Dawes et al., 2016). There is, however, considerable structure and hierarchy within these lists of hazards, with the finer level hazards aggregating to successively coarser resolutions. For example, a range of activities that are part of CSG operations might require the removal of site vegetation (the impact cause), including ground-based geophysics and the construction of pipeline networks, storage ponds, site processing plants, water treatment plants and access roads. All of these activities might potentially result in changes to surface water quality from soil erosion following heavy rainfall (impact mode).
It is sensible to aggregate hazards with the same causal pathway even if they occur because of different activities or at different life-cycle stages or at different time scales. These aggregated causal pathways are fairly generic and have substantial commonality between bioregions and subregions. Four causal pathway groups are specified to be used consistently in BAs:
- ‘Subsurface depressurisation and dewatering’ causal pathway group
- ‘Subsurface physical flow paths’ causal pathway group
- ‘Surface water drainage’ causal pathway group
- ‘Operational water management’ causal pathway group.
These causal pathway groups are presented as conceptual diagrams for coal mines and CSG operations in Figure 11 and Figure 12, respectively. They represent some of the key system components, activities and features of the coal resource development, and highlight some of the potential causal pathways that may occur in each of these causal pathway groups. These pictorial representations are generic and not drawn to scale, but provide a compelling way to visualise how potential impacts may eventuate.
For more detail about these causal pathway groups, as well as the causal pathways within them, see Appendix B. The names of these causal pathway groups and causal pathways are used to ensure consistency across all BAs.
For each aggregated impact cause, it is necessary to represent the chain of logic for that cause, either uniquely or in conjunction with other associated impact causes. There is no need to make the distinction between the causal pathways for baseline and the CRDP. Many of the pathways that exist will be common to both and will often result in similar effects in different places.
Figure 11 Conceptual diagram of the causal pathway groups associated with coal seam gas operations
This schematic diagram is not drawn to scale and is generic. In a hydrologically confined aquifer or coal measure, the water pressure level may rise above the top of the geological layer. Drawdown caused by coal seam gas extraction does not necessarily translate to changes in depth to the watertable.
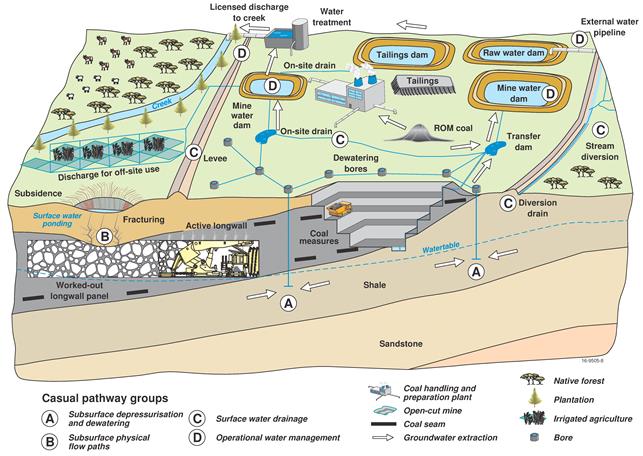
Figure 12 Conceptual diagram of the causal pathway groups associated with coal mines
This schematic diagram is not drawn to scale and is generic.
Figure 13 represents some of the causal pathways for hazards (impact causes, impact modes and activities) arising from CSG operations and open-cut coal mines in the Maranoa-Balonne-Condamine subregion. In particular, it illustrates two causal pathways form the ‘Subsurface depressurisation and dewatering’ causal pathway group (Table 7 in Appendix B). In Figure 13, there is no consideration of the hazard handling or scope discussed in Section 3.1.3.1.1. It is desirable to frame the hazards and pathways broadly to acknowledge what may change exhaustively before focusing on the highest priority causal pathways from a BA perspective.
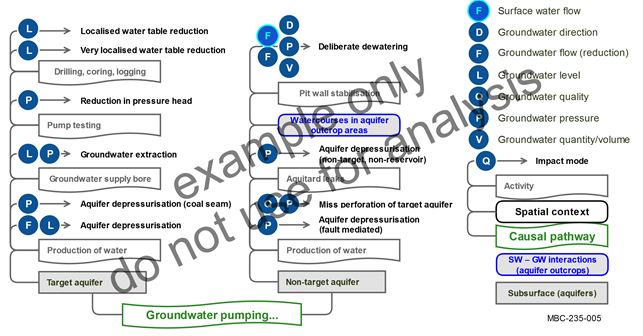
Figure 13 Example diagram: ‘Subsurface depressurisation and dewatering’ causal pathway group arising from coal seam gas operations and open-cut coal mines in the Maranoa-Balonne-Condamine subregion
Example only; do not use for analysis. This is an early draft of a diagram published in Holland et al. (2016). See Holland et al. (2016) for full explanation and interpretation of the final results, which might vary from that shown here.
Typology and punctuation are consistent with the hazard analysis (Bioregional Assessment Programme, Dataset 1).
‘Groundwater pumping…’ is shortened form for ‘Groundwater pumping enabling coal seam gas extraction’ and ‘Groundwater pumping enabling open-cut coal mining causal pathways’.
A more exhaustive set of causal pathway diagrams analogous to Figure 13 are presented in Appendix A. Collectively these set of diagrams represent the IMEA hazard spreadsheets graphically and allow a great number of the hazards and their natural groupings to be visualised simultaneously.
Influence or box-and-arrow diagrams are also useful for illustrating causal pathways. See Entrekin et al. (2011) for an influence diagram that indicates the potential causal pathways from hydraulic fracturing. Figure 14 is a preliminary causal pathway for CSG water management from the Clarence-Moreton bioregion. It presents a cross-section from the three-dimensional geological model with flow directions and highlights the particular layers that are important for CSG water management. It also illustrates specific water management pathways, including the extraction of surface water or groundwater for operations and the potential hydrological effects (i.e. reduced surface water flow and groundwater levels). Figure 14 also shows the potential pathways to impact through the storage and disposal of produced water, as well as the connection to other pathways (i.e. the groundwater extraction impact mode).
The stratigraphy will be different in other bioregions and subregions, and the details of the provision, storage and disposal of water will be specific to each development, but generally Figure 14 provides a template for communicating the logic of the causal pathway. The influence or box-and-arrow diagrams represent the more generic chain of logic while the stratigraphy shown in Figure 14 supports the required region-specific narrative.
The description so far has concentrated on the pathways to change but not where changes might be expected. It is important to consider the higher level spatial context for the aggregated hazards, considering where they occur (e.g. whether impacts will extend beyond the site, which aquifers will be depressurised or which landscape class might be affected). To constrain focus, the Assessment team must seek to rule out areas of the bioregion or subregion that will not be subject to any of the listed hazards.
At this stage the ruling out occurs on the basis of sound scientific reasoning. A groundwater divide might mean that certain parts of the bioregion or subregion cannot be impacted by mine-related drawdown, or it might not be plausible for a section of a stream network upstream of the coal resource development to be impacted hydrologically. Create a table or a matrix that lists and describes potential causal pathways and the unique landscape classes that may be impacted. The objective is to identify which landscape classes are potentially subject to multiple causal pathways and rule out any landscape classes that will not be affected by any.
It is not necessary, nor possible, to enumerate all the causal pathways, particularly spatially. Numerical hydrological models will integrate understanding and ultimately represent the causal pathways spatially, for those BAs that are developing such models. Product 2.3 (conceptual modelling) focuses on laying out the underpinning understanding through the various conceptual models and the numerical hydrological models, and emphasising the most important causal pathways. It is essential to annotate and support the hypothesised causal pathways with a narrative and detailed scientific evidence base for both the generic pathways and the local context wherever possible in order to achieve the aim of transparency and to demonstrate the underlying science quality and credibility.
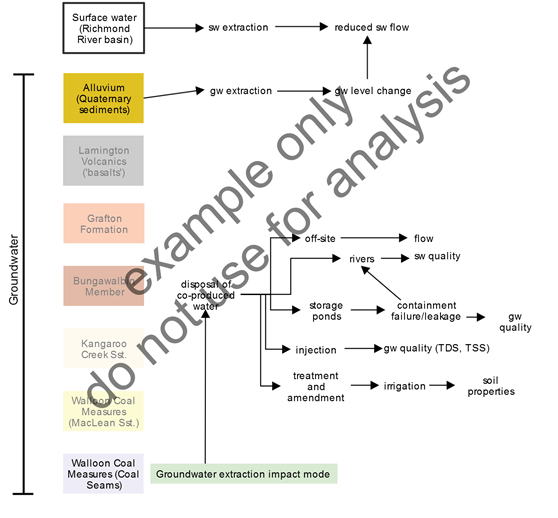
Figure 14 Example diagram: causal pathway group ‘Operational water management’ arising from coal seam gas operations in the Clarence-Moreton bioregion
Example only; do not use for analysis. This is an early draft of a figure published in Raiber et al. (2016). See Raiber et al. (2016) for full explanation and interpretation of the final results, which might vary from that shown here.
GW corresponds to groundwater; SW corresponds to surface water; TDS corresponds to total dissolved solids; TSS corresponds to total suspended solids.
3.1.4 Step 8: summarise causal pathways
The last step in Figure 8 is to identify, compare and contrast the causal pathways for baseline and the CRDP, including differences in their spatial and temporal extent, and potentially impacted landscape classes.
Three-dimensional visualisations or pictorial representation of the bioregion or subregion, and contrasts between the causal pathways for the baseline and the CRDP, are not expected as part of product 2.3 (conceptual modelling) though can be included if they exist. Detailed three-dimensional visualisations or pictorial representation may, however, be created as part of product 3-4 (impact and risk analysis) and will incorporate additional evidence from the numerical modelling.
3.1.5 External engagement
It is essential to seek external input and confirmation of the causal pathways, given the critical role they will play in the modelling, impact and risk work that follows. This is the opportunity to rigorously test our understanding with local expertise while there is an opportunity to make changes or reframe. If something is missed and surprises occur later in the process it will be much more difficult to address.
This engagement is expected to be done through an external workshop, although alternative and more distributed forms of consultation may be appropriate in some circumstances, for example if there are logistical challenges in getting everyone in the same room. A two-day workshop is probably necessary given the context setting required and the detailed conversation that may be required around specific causal pathways and their spatial and temporal contexts.
Many of the causal pathways need to be prepared prior to the workshop. It is recommended that these be substantially complete, so the participants can move through the non-contested pathways quickly and focus on those that are more contentious or potentially incomplete or missing. This discussion will need to be structured so that targeted questions can be asked to test the boundaries of thinking, but also flexible so that alternative views can be accepted and used to update the understanding. For example, if the presence and location of faults is a knowledge gap that may potentially affect the connectivity between aquifers, it will make sense to focus on faults specifically, reflecting the BA synthesis of the current state of knowledge and its evidence base, before seeking any additional workshop input around the location and role of any faults that may exist.
Frame the identification of causal pathways broadly by considering all hazards that are identified and noting those that are out of scope, handled by other processes (e.g. site-based risk management) or assessed by hazard analysis as lower priority. Concentrate on finding reasons to rule out specific pathways or pathways from particular parts of the PAE. The more the Assessment team can focus on pathways that might cause impacts, or on areas that might receive impact, and away from pathways or areas that will not, the better. This ruling out needs to be done in a principled and conservative way by using a strong logic and evidence base, but will help ensure that resources are used efficiently in the BA.
It is important to give people enough time to digest and make suggestions. Circulating material prior to workshop may be useful. It also may be beneficial to give people the chance to leave at the end of the day, but then come back later with fresh eyes and the opportunity to provide further feedback. Draw on generic BA material where possible, as many of the causal pathways will be common across bioregions and subregions and need to be only tailored for local conditions.
The audience needs to be chosen so that they can speak confidently about the pathways and avoid potential blind spots. Where possible, more than one expert should be consulted in each discipline. Consider inviting different participants for different sessions; the landscape classification might require different participants than a development-focused session.
Pictures worth a thousand words: a guide to pictorial conceptual modelling (Department of Environment and Heritage Protection, 2012) is a useful guide to running a science synthesis workshop for conceptual modelling.
It is important for the Assessment teams to carefully consider bioregion- or subregion-specific conceptual modelling resources that exist (see Section 2.6). Leveraging off existing work and expertise wherever possible will help ensure that BA conceptual models will resonate with the local community. These specific resources are too numerous to consider in this submethodology but are an essential part of the evidence base.
3.2 Knowledge gaps and uncertainties
Where there is knowledge in how the physical and biological systems work and interact with coal resource developments, it is important for that knowledge to be embedded in the conceptual modelling and supported by a scientific evidence base. If there are known knowledge gaps and uncertainties in those systems, a key objective of the conceptual modelling is to highlight them. One approach is to aim for a sufficiently general depiction of the system that nonetheless identifies or encompasses alternative interpretations. Where greater detail or emphasis is required then one can proceed with the development of alternatives or variant model depictions. Such alternative models can be a key feature of engagement with stakeholders that lends credibility to the overall risk analysis, but also serves as a means to focus research or risk analyses on key uncertainties. Any model is an abstraction of reality, and here it is purposefully incomplete, and thus always lacking or wrong by some measure. The measure of worth of the model is not only how faithfully it represents the real world, but also how well it focuses researchers and stakeholders on the essential details of a shared understanding of how the system works.
