This section provides a baseline assessment of groundwater quality within the major aquifers of the Maranoa-Balonne-Condamine subregion (Table 10). The groundwater quality for the whole subregion is presented here as water quality is not being modelled as part of the Bioregional Assessment Programme. Hydrochemistry summary statistics and spatial variation maps are provided for the major aquifers. To assess potential hazards associated with using groundwater in the subregion, a comparison of relevant parameters against guidelines for human consumption is provided. In addition, stock watering and water for long-term irrigation (defined as up to 100 years) was also considered.
Trigger values (Table 11) were taken from the Australian Drinking Water Guidelines (ADWG) (National Health and Medical Research Council, 2011) and the National Water Quality Management Strategy (NWQMS) (ANZECC, 2000).
1.5.2.2.1 Data sources and analysis
Hydrochemistry data (Geoscience Australia, Dataset 1) were sourced from the Geoscience Australia (2014) GA NCF Hydrochemistry - Surat Region. This dataset includes data for the Condamine Alluvium and Main Range Volcanics derived from the Office of Groundwater Impact Assessment (OGIA, 2013). The dataset identifies the particular geological unit from which the water sample was obtained. This information has been used as a basis for grouping the data into the hydrostratigraphic units that represent the major water-bearing units in the subregion (Table 10). It should be noted individual units that are hydrogeologically equivalent to each other have been grouped and assigned an aquifer name based on the primary contributing geological unit. Aquifers containing multiple units are referred to in Table 10 as the Rolling Downs Group aquifers, the Hooray Sandstone and equivalents aquifer and the Hutton Sandstone aquifer. Only those formations for which water quality data was available have been included in this analysis.
The Hooray Sandstone and equivalents aquifer group comprises the Bungil Formation aquifer, Mooga Sandstone aquifer, the Gubberamunda Sandstone aquifer, Kumbarilla Beds aquifer, Pilliga Sandstone aquifer and the Hooray Sandstone aquifer. This composite sequence of aquifers forms part of the major artesian aquifer of the GAB referred to as the Cadna‑owie – Hooray aquifer and equivalents (Radke et al., 2000).
Table 10 Aquifer grouping for water quality reporting
aThe Evergreen Formation is recognised as a regional aquitard. Some analyses have the Evergreen Formation assigned as the contributing water-bearing formation. It is likely that the Boxvale Sandstone Member, which is an aquifer within the Evergreen Formation, is the contributing formation (Ransley and Smerdon, 2012).
Table 11 Water quality standards for trace elements
aTable 10.5 in Australian Drinking Water Guidelines NHMRC (2011)bTable 4.2.10 in National Water Quality Management Strategy ANZECC (2000)cTable 4.3.2 in National Water Quality Management Strategy ANZECC (2000)dElectrical Conductivity is measured in µS/cmeAesthetic water quality trigger (not health related)fUranium is measured in parts per billion NA means ‘not applicable’ because there is no relevant standard Data: Geoscience Australia (Dataset 1)
1.5.2.2.2 Total dissolved solids, pH and alkalinity
A total of 4317 groundwater analyses were used to calculate aquifer mean and median values for total dissolved solids (TDS) (Table 12), 4939 analyses for mean and median alkalinity (Table 12) and 4842 analyses for median values for laboratory pH (Table 13). The maximum and minimum pH values are also provided to show the range of these values for each aquifer. The values can be compared to the water quality guidelines for human consumption, irrigation and stock watering in Table 14.
Table 12 Mean and median total dissolved solids and alkalinity for aquifers of the Maranoa-Balonne-Condamine subregion
Data: Geoscience Australia (Dataset 1)
Table 13 Median, minimum and maximum laboratory pHa for the aquifers in the Maranoa-Balonne-Condamine subregion
aThese values are for laboratory pH. There are a limited number of samples with field pH recorded at the time when other field measurements were recorded (e.g. electrical conductivity, dissolved oxygen, redox) and when samples were prepared for laboratory analysis (e.g. cations and anions, stable isotopes). Groundwater pH may change during transport to the laboratory due to exchange with the atmosphere, which means that laboratory pH may not be representative of actual pH at the time of sampling. Therefore, laboratory pH is not an appropriate approximation in the absence of field pH when undertaking more in-depth hydrochemical analysis.bThese maximum pH values are abnormally high but have been left in to show the range of values in the data. It is rare for groundwater to have such high pH values. Data: Geoscience Australia (Dataset 1)
Table 14 Water quality standards for total dissolved solids, alkalinity and pH
|
Parameter |
ADWGa guidelines for human consumption (mg/L) |
Irrigation guidelinesb (mg/L) |
Stock guidelinesc (mg/L) |
|
Total dissolved solids |
<600d |
NA |
<4000 |
|
Alkalinity |
NA |
NA |
NA |
|
pH |
6.5-8.5d |
4-9 |
4-9 |
aTable 10.5 in Australian Drinking Water Guidelines NHMRC (2011)bSection 4.2 in National Water Quality Management Strategy ANZECC (2000)cSection 4.3 in National Water Quality Management Strategy ANZECC (2000)dAesthetic water quality trigger (not health related) NA means ‘not applicable’ because there is no relevant standard
1.5.2.2.3 Total dissolved solids, pH and alkalinity distribution
Spatial interpolation
TDS, alkalinity and laboratory pH data from bores were used to generate trend maps for the aquifer groups using the ‘topo to raster’ interpolation method in ArcGIS. This is an iterative finite difference interpolation technique, which allows for surface continuity in sparse datasets. The available hydrochemistry data does not represent a single snapshot of water quality at a specific time; rather they provide a general indication of variations in hydrochemistry across the subregion. Furthermore, there is likely to be variations in quality of the sample analyses used to create the maps due to the archival nature of the data. Factors affecting archival data can include: use of different analysis methods; improvements in analyses technology over time; analysis accuracy and precision; variations in sample collection methodologies, and different bore construction techniques and quality. The archival nature of the data used means that temporal variation in water chemistry may contribute to the range of values seen in the hydrochemistry surfaces. However, the total spatial variation in hydrochemical composition of groundwater for each hydrostratigraphic unit is at least one (and up to three) orders of magnitude. Thus, any temporal variations are expected to be relatively minor in comparison to spatial variability in groundwater composition.
Distribution of bores is often limited to within the vicinity of outcrop areas. Results may also be skewed in part through clustering of bores in areas where there is high production due to the presence of relatively high quality water, or alternatively areas with undesirable water quality are likely to have fewer bores to constrain interpolation. Interpretation of the hydrochemistry surfaces should be considered with these uncertainties in mind, and these maps should be treated as an image of regional trends in hydrochemistry for the hydrostratigraphic units in the subregion rather than a predictive tool for determining water quality where there is little bore coverage.
A map of the spatial distribution of TDS, alkalinity and pH and the data locations for each aquifer unit is provided in Figure 15 to Figure 18.
It should be noted that in order to have enough data for spatial pH plots it was necessary to use laboratory pH rather than the more accurate field pH. Field pH is recorded at the time when other field measurements were recorded (e.g. electrical conductivity, dissolved oxygen, redox) and when samples were prepared for laboratory analysis (e.g. cations and anions, stable isotopes). Groundwater pH may change during transport to the laboratory due to exchange with the atmosphere, which means that laboratory pH may not be representative of actual pH at the time of sampling. Therefore, laboratory pH is not an appropriate approximation in the absence of field pH when undertaking more in-depth hydrochemical analysis.
Condamine Alluvium aquifer
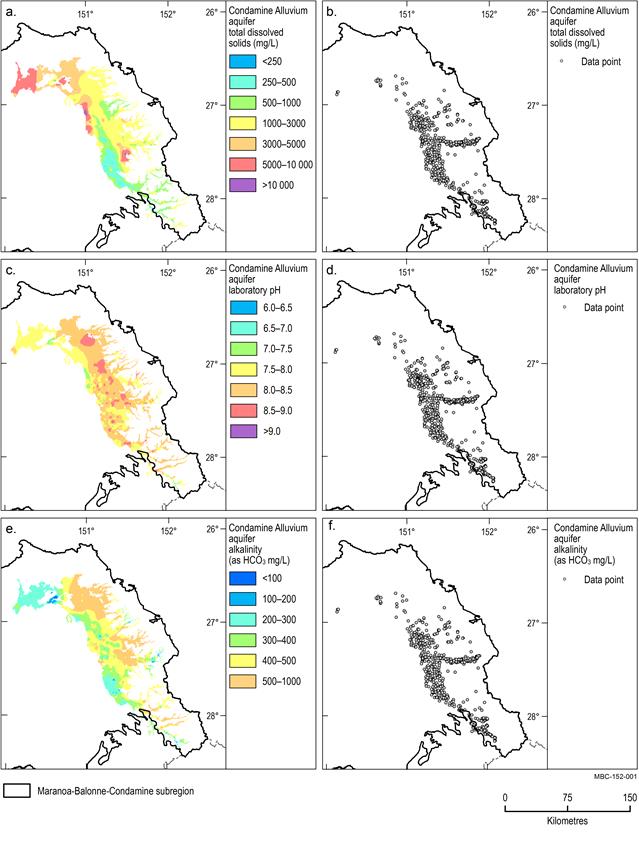
Groundwater within the Condamine Alluvium aquifer is generally fresh and has median TDS and alkalinity concentrations of 830 mg/L and 390 mg/L respectively (Figure 15a and Figure 15e). The median groundwater pH is 8.1 and ranges from slightly acidic (pH 5.6) to highly alkaline (pH 9.6) (Figure 15c).
TDS concentrations are lowest (less than 500 mg/L) adjacent to the Condamine River and its upper tributaries, in the south of the area. TDS concentrations increase downstream, with maximum TDS slightly less than 5000 mg/L in the north-west extent of the mapped alluvium. Alkalinity concentrations show a similar distribution to that of TDS in the south-east with low values (less than 400 mg/L) evident adjacent to the Condamine River. However, in contrast to downstream increasing TDS values, alkalinity remains low, with concentrations less than 300 mg/L at the north-western extent of the mapped alluvium.
Main Range Volcanics aquifers
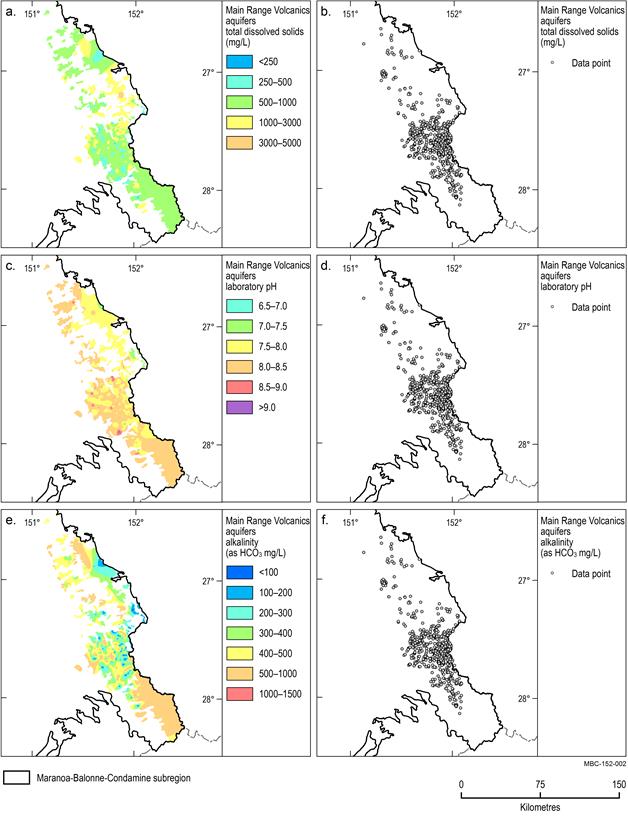
Groundwater within the Main Range Volcanics aquifer is generally fresh with median TDS and alkalinity concentrations of 651 mg/L and 345 mg/L respectively (Figure 16a and Figure 16e). The median groundwater pH is 8.0 and ranges from slightly acidic (pH 5.4) to highly alkaline (pH 10) (Figure 16c).
TDS concentrations of less than 1000 mg/L exist over much of the southern and northern extents of the aquifer. An area of elevated TDS (greater than 1000 mg/L) is present in the central eastern portion of the aquifer. Alkalinity concentrations are very low, less than 100 mg/L, along the north‑eastern boundary of the aquifer, increasing westward.
Rolling Downs Group aquifers
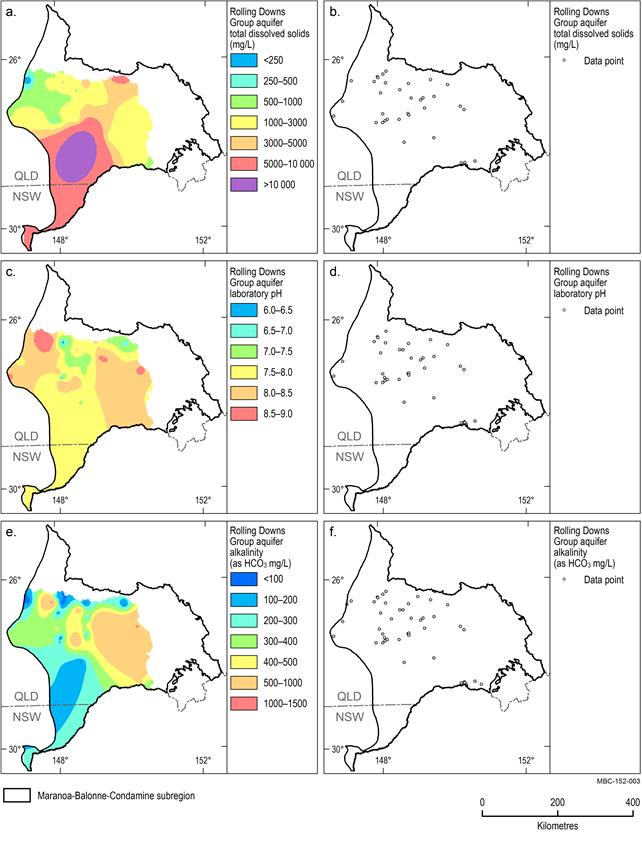
The TDS, pH and alkalinity distribution of the Rolling Downs Group (RDG) are shown in Figure 17a, Figure 17b and Figure 17c respectively. There are no groundwater analyses for the RDG in the south‑west of the subregion (Figure 17b, Figure 17d and Figure 17f). Alkalinity concentrations in the RDG have a median of 416 mg/L. Alkalinity concentrations are generally low (less than 200 mg/L) along the northern boundary of the unit. The eastern boundary of the unit is characterised by elevated alkalinity (greater than 500 mg/L) which extends toward the centre of the subregion.
TDS concentrations are highest in the centre of the subregion, where a limited number of samples exceed 10,000 mg/L. The median TDS for the RDG is 1141 mg/L. The pH values in the RDG range from slightly acidic (6.2) to alkaline (9.0) and have a median value of 8.1. Across the subregion, pH in the RDG is generally slightly alkaline to alkaline with areas of near neutral concentrations in the centre and northern portions of the unit.
Hooray Sandstone and equivalents aquifer
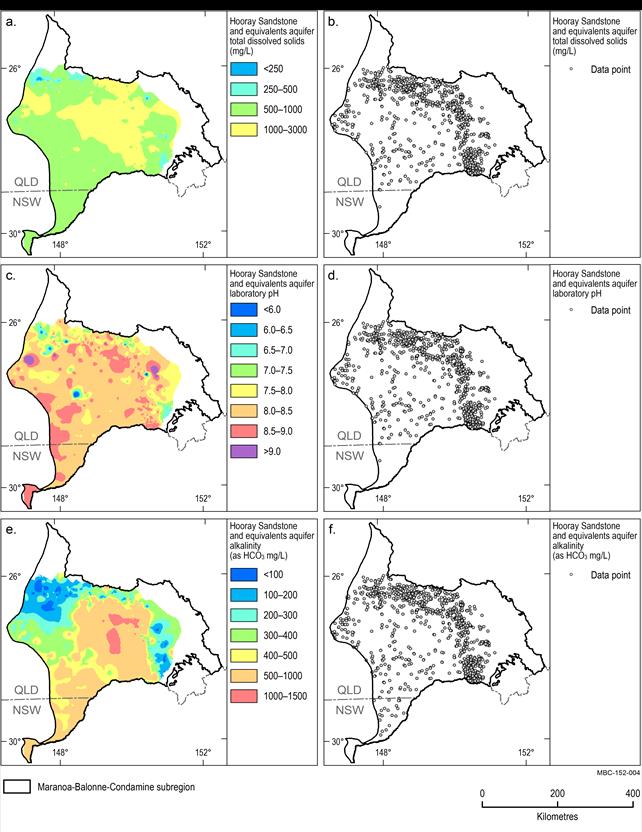
The median TDS in the Hooray and equivalents aquifer is 962 mg/L. The TDS concentration distribution is fairly uniform across the unit with areas of very low TDS (less than 500 mg/L) generally occurring close to the aquifer margins where recharge occurs (Figure 18). Note that only one TDS analysis was available in the southern NSW portion of the subregion (Figure 18b). Laboratory pH ranges from 3.2 to 12.6 (such a high value is likely to be incorrect, as it is rare for groundwater to have such a high pH) with a median of 8.3 (Figure 18e). The median alkalinity concentration is 524 mg/L. Alkalinity concentrations are relatively high (1000 mg/L) toward the centre and south of the subregion, with the lowest concentrations (less than 400 mg/L) occurring toward the margins of the units adjacent to the aquifer recharge areas (Figure 18e).
Data: Geoscience (Dataset 1)
Data: Geoscience Australia (Dataset 1)
Data: Geoscience Australia (Dataset 1)
Data: Geoscience Australia (Dataset 1)
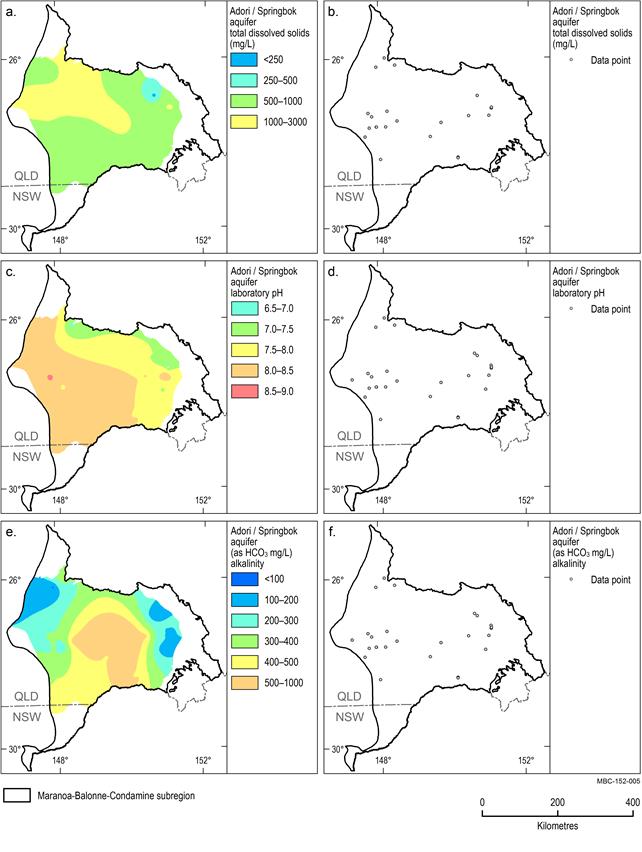
Adori / Springbok aquifer
A limited number of analyses were available for the Adori / Springbok aquifer (Figure 19b, Figure 19d and Figure 19f). The median TDS concentration for this aquifer is 803 mg/L. The highest TDS concentrations (greater than 1000 mg/L) occur in the north-western area of the subregion (Figure 19a). pH for the Adori / Springbok aquifer ranges from acidic (4.2) to alkaline (9.9) and has median values of 8.1. Near neutral pH occurs in groundwater along the north-eastern margin of the unit, becoming increasingly alkaline to the south-west of the region (Figure 19c). The median alkalinity concentration for the Adori / Springbok aquifer is 295 mg/L. The highest alkalinity concentrations (greater than 500 mg/L) occur in the centre of the subregion and decrease toward the north-west and eastern boundary of the subregion (Figure 19e).
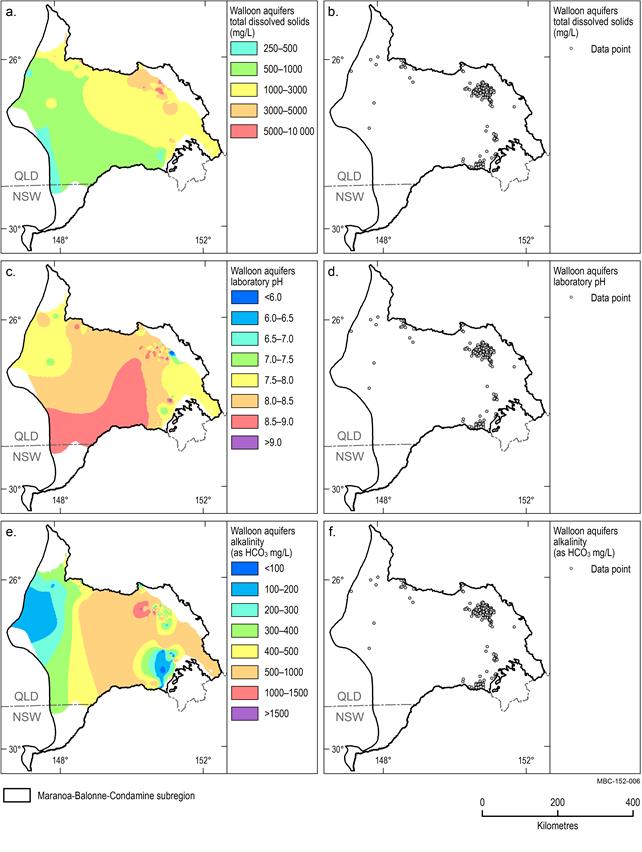
Walloon aquifers
The distribution of data points within the Walloon aquifers is clustered in the east and, to a lesser extent, the northern boundary of the unit. There were limited or no data available in the centre and south-west of the subregion to inform this analysis (Figure 20b, Figure 20d, Figure 20f). Groundwater within the Walloon aquifers is generally brackish with a median TDS concentration of 2079 mg/L – the second highest value for the subregion (Figure 20d). pH values range from highly acidic (3.8) to highly alkaline (11.4) (it is likely that this value is incorrect as it is rare for groundwater to have such a high pH) with a median value of 8.1. The large area of alkaline water (pH greater than 8.5) mapped on Figure 20c is an artefact of the uneven data distribution and unlikely to represent actual conditions. The median alkalinity concentration for this unit is 448 mg/L with lower alkalinity areas in the west and south-east of the subregion (Figure 20e).
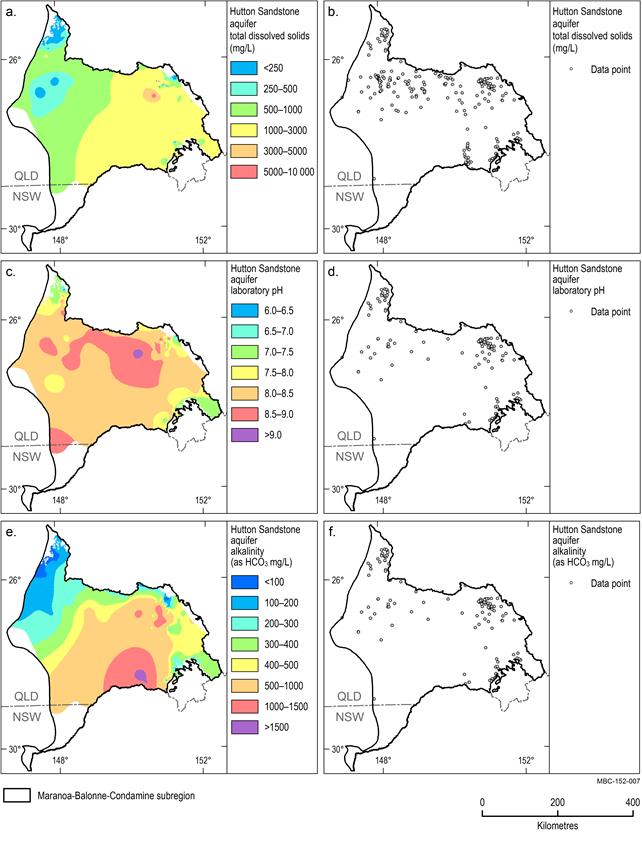
Hutton Sandstone aquifer
The TDS, pH and alkalinity distribution of the Hutton Sandstone aquifer are shown in Figure 21. Median TDS is 978 mg/L and TDS is slightly lower in the north-west of the subregion. TDS concentrations over much of the eastern half of the region are relatively higher (greater than 1000 mg/L) and become brackish (greater than 1500 mg/L) in some isolated areas. TDS in the western half of the subregion is relatively lower (less than 1000 mg/L). The low concentrations that occur at the northernmost boundary of the subregion are coincident with the aquifer recharge area where the aquifer outcrops at the surface. Groundwater pH values range from slightly acidic (6.4) to alkaline (9.7) with a median value of 8.2. Much of the subregion is characterised by slightly alkaline groundwater (pH greater than 8) with small areas of near neutral groundwater limited to the isolated areas along the northern and eastern boundary of the subregion (Figure 21c). Alkalinity in the Hutton Sandstone aquifer generally increases from north to south, with concentrations exceeding 1500 mg/L in isolated areas (Figure 21e). The median alkalinity for the Hutton Sandstone aquifer is 515 mg/L.
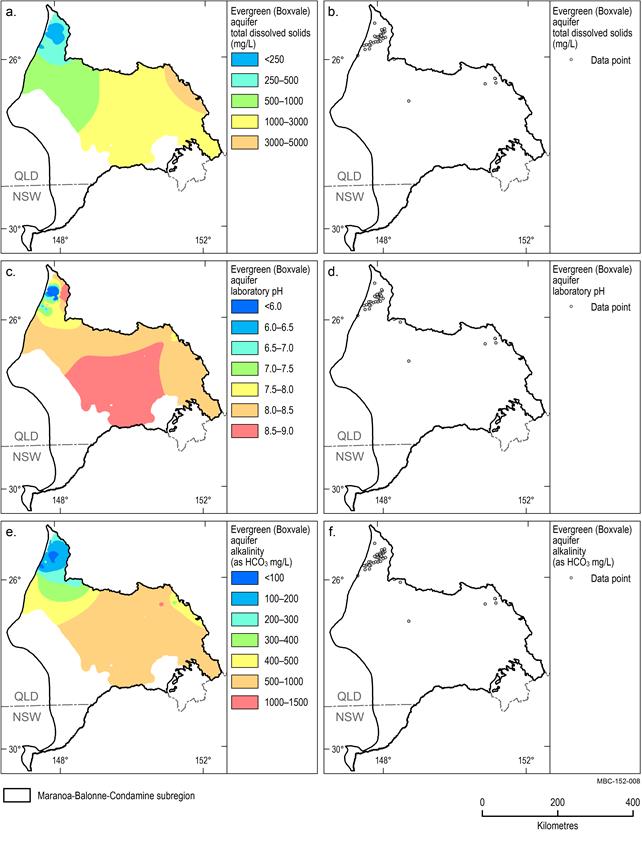
Evergreen (Boxvale) aquifer
Limited data are available within the Evergreen (Boxvale) aquifer and the most data points are concentrated in the northernmost portion of the subregion (north of 26° latitude) (Figure 22). It should be noted that the interpolated values are unreliable south of 26°latitude as there are no data points to constrain them.
The median TDS concentration is 221 mg/L, which is the lowest of all hydrogeological units in the subregion (Figure 22a). The median alkalinity concentration is 132 mg/L (Figure 22e). Groundwater pH ranges from acid (pH 5.9) to alkaline (pH 8.7), with a median value of 7.8 (Figure 22c).
Data: Geoscience Australia (Dataset 1)
Data: Geoscience Australia (Dataset 1)
Data: Geoscience Australia (Dataset 1)
Data: Geoscience Australia (Dataset 1)
Precipice Sandstone aquifer
The distribution of data within the Precipice Sandstone aquifer is limited and is insufficient to produce spatial distribution maps for the subregion. The median TDS concentration within the Precipice Sandstone aquifer is 1940 mg/L. Groundwater pH ranges from slightly acidic (6.4) to alkaline (9.1) and has a median pH value of 8.3. The median alkalinity concentration is 878 mg/L and alkalinity ranges between 30 and 1776 mg/L.
1.5.2.2.4 Trace elements
Exceedances for the trace elements available in the dataset were determined using the Australian Drinking Water Guidelines (ADWG) for human consumption (NHMRC, 2011). Exceedances for irrigation and stock water were determined using trigger values in the National Water Quality Management Strategy (NWQMS) (ANZECC, 2000). The trigger values are shown in Table 11. Trace element ranges and the number of exceedances in the dataset are shown in Table 15 to Table 23.
Table 15 Condamine Alluvium aquifer water quality compared to standards
aTable 10.5 in Australian Drinking Water Guidelines NHMRC (2011)bTable 4.2.10 in National Water Quality Management Strategy ANZECC (2000)cTable 4.3.2 in National Water Quality Management Strategy ANZECC (2000)dElectrical Conductivity is measured in µS/cm Data: Geoscience Australia (Dataset 1)
Table 16 Main Range Volcanics aquifers water quality compared to standards
aTable 10.5 in Australian Drinking Water Guidelines NHMRC (2011)bTable 4.2.10 in National Water Quality Management Strategy ANZECC (2000)cTable 4.3.2 in National Water Quality Management Strategy ANZECC (2000)dElectrical Conductivity is measured in µS/cm Data: Geoscience Australia (Dataset 1)
Table 17 Rolling Downs Group aquifers water quality compared to standards
aTable 10.5 in Australian Drinking Water Guidelines NHMRC (2011)bTable 4.2.10 in National Water Quality Management Strategy ANZECC (2000)cTable 4.3.2 in National Water Quality Management Strategy ANZECC (2000)dElectrical Conductivity is measured in µS/cmeAesthetic water quality trigger (not health related) NA means ‘not applicable’ because there is no relevant standard Data: Geoscience Australia (Dataset 1)
Table 18 Hooray Sandstone and equivalents aquifer water quality compared to standards
aTable 10.5 in Australian Drinking Water Guidelines NHMRC (2011)bTable 4.2.10 in National Water Quality Management Strategy ANZECC (2000)cTable 4.3.2 in National Water Quality Management Strategy ANZECC (2000)dElectrical Conductivity is measured in µS/cmeAesthetic water quality trigger (not health related)fUranium is measured in parts per billion NA means ‘not applicable’ because there is no relevant standard Data: Geoscience Australia (Dataset 1)
Table 19 Adori / Springbok aquifer water quality compared to standards
aTable 10.5 in Australian Drinking Water Guidelines NHMRC (2011)bTable 4.2.10 in National Water Quality Management Strategy ANZECC (2000)cTable 4.3.2 in National Water Quality Management Strategy ANZECC (2000)dElectrical Conductivity is measured in µS/cmeAesthetic water quality trigger (not health related) NA means ‘not applicable’ because there is no relevant standard Data: Geoscience Australia (Dataset 1)
Table 20 Walloon aquifers water quality compared to standards
aTable 10.5 in Australian Drinking Water Guidelines NHMRC (2011)bTable 4.2.10 in National Water Quality Management Strategy ANZECC (2000)cTable 4.3.2 in National Water Quality Management Strategy ANZECC (2000)dElectrical Conductivity is measured in µS/cmeAesthetic water quality trigger (not health related) NA means ‘not applicable’ because there is no relevant standard Data: Geoscience Australia (Dataset 1)
Table 21 Hutton Sandstone aquifer water quality compared to standards
aTable 10.5 in Australian Drinking Water Guidelines NHMRC (2011)bTable 4.2.10 in National Water Quality Management Strategy ANZECC (2000)cTable 4.3.2 in National Water Quality Management Strategy ANZECC (2000)dElectrical Conductivity is measured in µS/cmeAesthetic water quality trigger (not health related)fUranium is measured in parts per billion NA means ‘not applicable’ because there is no relevant standard Data: Geoscience Australia (Dataset 1)
Table 22 Evergreen (Boxvale) aquifer water quality compared to standards
aTable 10.5 in Australian Drinking Water Guidelines NHMRC (2011)bTable 4.2.10 in National Water Quality Management Strategy ANZECC (2000)cTable 4.3.2 in National Water Quality Management Strategy ANZECC (2000)dElectrical Conductivity is measured in µS/cmeAesthetic water quality trigger (not health related)fUranium is measured in parts per billion NA means ‘not applicable’ because there is no relevant standard Data: Geoscience Australia (Dataset 1)
Table 23 Precipice Sandstone aquifer water quality compared to standards
aTable 10.5 in Australian Drinking Water Guidelines NHMRC (2011)bTable 4.2.10 in National Water Quality Management Strategy ANZECC (2000)cTable 4.3.2 in National Water Quality Management Strategy ANZECC (2000)dElectrical Conductivity is measured in µS/cmeAesthetic water quality trigger (not health related)fUranium is measured in parts per billion NA means ‘not applicable’ because there is no relevant standard Data: Geoscience Australia (Dataset 1)
1.5.2.2.5 Gaps
The available groundwater chemistry data is unevenly distributed for many of the hydrogeologic units, specifically the Evergreen (Boxvale) aquifer, Walloon aquifer and Adori / Springbok aquifer. Large areas of these units have little or no data to constrain the interpolated hydrochemistry spatial distribution mapping, thus reducing its reliability in some areas. Data for the Precipice Sandstone was so sparse it was not possible to produce hydrochemical spatial distribution maps.
A limited amount of field pH data is available to provide an accurate picture of the in situ pH conditions of groundwater in the subregion.
The quality of the hydrochemistry data available for this assessment is difficult to determine, as analytical uncertainties are not reported in the dataset. The dataset includes chemical analyses of differing ages, sometimes decades apart, which will have differing levels of accuracy and precision.
