The groundwater accounts reported here pertain to the Surat cumulative management area (Surat CMA, Figure 7) as identified by the Office of Groundwater Impact Assessment (OGIA) of the Queensland Government. Surat CMA covers approximately 66% of the total area of the Maranoa-Balonne-Condamine subregion. Whilst the OGIA regional groundwater model covers a larger area of the Maranoa-Balonne-Condamine subregion, the water accounts provided in this section are consistent with the Surat Underground Water Impact Report (QWC, 2012). Groundwater modelling for the bioregional assessment of Maranoa-Balonne-Condamine subregion will be performed using the groundwater model built by OGIA targeting the Surat CMA. Hence, information on groundwater allocations and estimated use of groundwater as at the final quarter of 2012 is reported for the area demarcated by the Surat CMA rather than for the entire Maranoa-Balonne-Condamine subregion. This is determined from water accounts data supplied by OGIA (Dataset 1, Dataset 3) and Queensland Government (Dataset 4). Groundwater quality reported in Section 1.5.2.2 is for the entire Maranoa-Balonne-Condamine subregion, because water quality will not be modelled in this round of bioregional assessments.
1.5.1.2.1 Current water accounts
Requirements for water licences are triggered by the rules defined under water resource plans for groundwater management areas and sub-artesian areas in Queensland. A water licence is required if the:
- bore is artesian, regardless of purpose
- bore is sub-artesian and is located within a declared sub-artesian area or a groundwater management area
- sub-artesian bore is regulated by the Great Artesian Basin Water Resource Plan (GAB WRP).
The circumstances in which a water license becomes essential is explained in the subsequent sections.
For the bioregional assessment of the Maranoa-Balonne-Condamine subregion, stock, domestic and other commercial uses of water are accounted for as per the entitlements in the relevant water resource plans (WRPs) for the relevant management areas. Water use by the coal seam gas (CSG) industry is accounted for based on data supplied by CSG companies to OGIA. Groundwater accounts for the Surat CMA are broadly classified as water use for non‑petroleum and non-CSG activities and water use for petroleum and CSG activities.
Groundwater account for non-petroleum and non-coal seam gas activities
Groundwater extracted for and used for purposes other than petroleum production (including CSG production) in the Surat CMA includes stock and domestic, agriculture, industrial and urban water use. Agricultural uses include irrigation, aquaculture, dairying, and intensive stock watering. Industrial uses include commercial and mining and water use by other industries. Urban water use is primarily for town water supplies. Groundwater licensing for non-petroleum and non-CSG uses is stipulated by Queensland’s Water Act 2000 and depends on the aquifer system and risk to resource. Water use from Great Artesian Basin (GAB) aquifers requires a water licence for all non‑petroleum and non-CSG activities including stock and domestic use in most circumstances. For uses other than stock and domestic, licensed allocation stipulates an annual volumetric limit. Similarly, water use from the Condamine Alluvium aquifer is subject to water licensing with a volumetric limit for all non-stock and domestic uses. A statutory authorisation exists for stock and domestic use, meaning that a water licence is not required. While many bores with a volumetric limit are metered, most stock and domestic bores are not metered in the Surat CMA.
Licensing provisions required for water use are administered by the Queensland Department of Natural Resources and Mines (DNRM). DNRM holds the database containing information about water licences, authorised volumetric limits, details of bores and recorded water use.
Estimated water use for bores with a volumetric entitlement is the maximum authorised volume as per the water licence. However, actual water use may be less than this. OGIA estimated the water use for the stock and domestic bores by following the methodology used in the GAB water resource planning process and the Murray–Darling Basin planning process (QWC, 2012). A number of criteria were considered by this methodology in estimating the water use. These include considerations of the aquifer in which the bore is screened, property size, whether the property is rural or urban, and whether groundwater is the primary water source. Estimated annual non‑petroleum and non-CSG groundwater usage per bore for the Surat CMA (Bioregional Assessment Programme, Dataset 2) is shown in Figure 7.
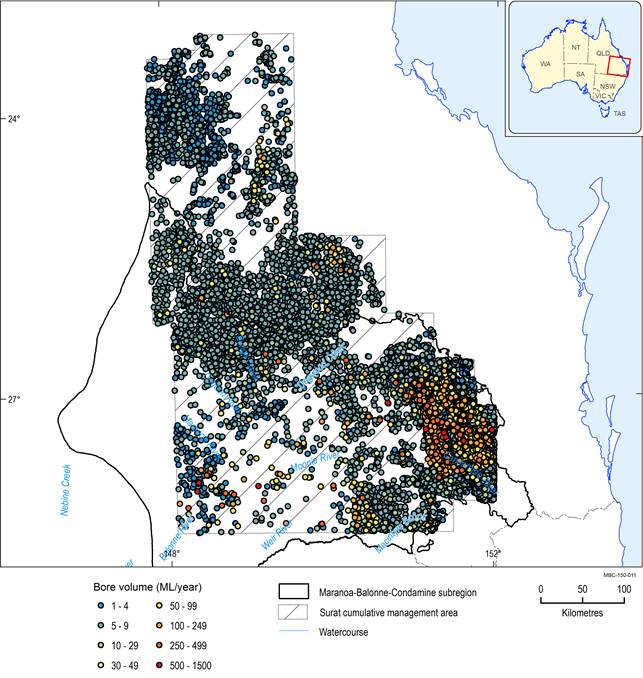
Data: Bioregional Assessment Programme (Dataset 2), Department of Environment and Heritage Protection (Dataset 5)The estimated water use was based on the entitlement for majority of the bores. Where entitlement is not available (e.g. Volcanics), water use was estimated based on other criteria including aquifer type, property type etc. as mentioned earlier.
Based on this approach, OGIA estimated the total non-petroleum and non-CSG water extraction in the Surat CMA as 215 GL/year from about 21,200 water bores (QWC, 2012; Office of Groundwater Impact Assessment, Dataset 3). This is comprised of 85 GL/year from GAB aquifers and 130 GL/year from other aquifers. Table 3 gives estimates of the number of bores and Table 4 of their extraction rates in GAB and non-GAB aquifers.
Figure 8 shows the distribution of groundwater bores indicating the aquifer from which water is extracted.
Table 3 Number of bores for uses other than petroleum and gas production in Surat cumulative management areaa
aThis table is modified from QWC (2012).
Table 4 Estimated groundwater extraction (ML/year) for uses other than petroleum production in Surat cumulative management areaa
aThis table is modified from QWC (2012).
bThis is estimated annual use based on entitlements administered by DNRM. The total underlying entitlement is approximately 99 GL/year.
na – not applicable
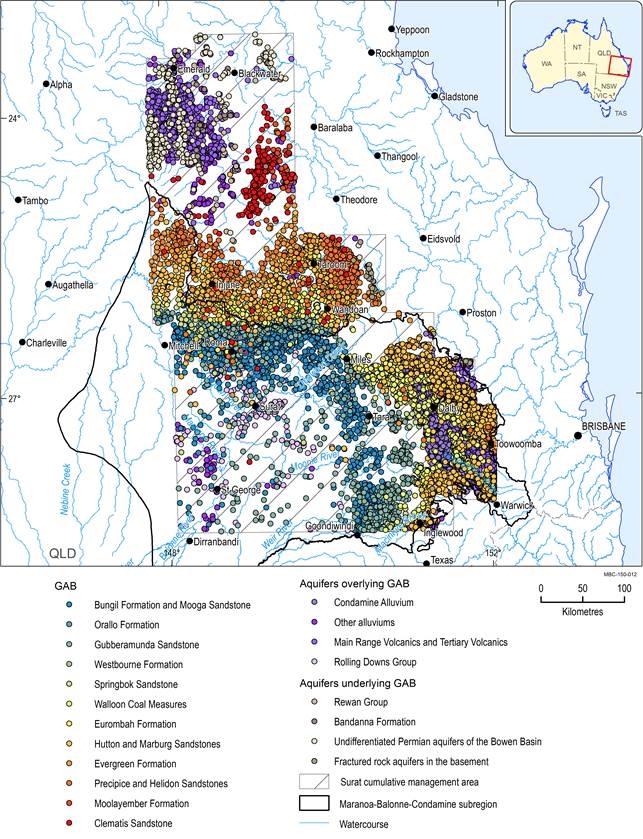
Figure 8 Groundwater bores identified by aquifer source in the Surat cumulative management area
Data: Bioregional Assessment Programme (Dataset 2), Department of Environment and Heritage Protection (Dataset 5)
Around 66% of the groundwater extraction from the aquifers overlying GAB is used for agriculture. The second major use of groundwater in the alluvial aquifers and Main Range Volcanics aquifers is for stock and domestic use accounting for about 28% of the total use. Stock and domestic use accounts for the major groundwater use of the GAB aquifers at around 56%, while the use for agriculture is around 26%. The distribution of the groundwater bores by purpose is shown in Figure 9.
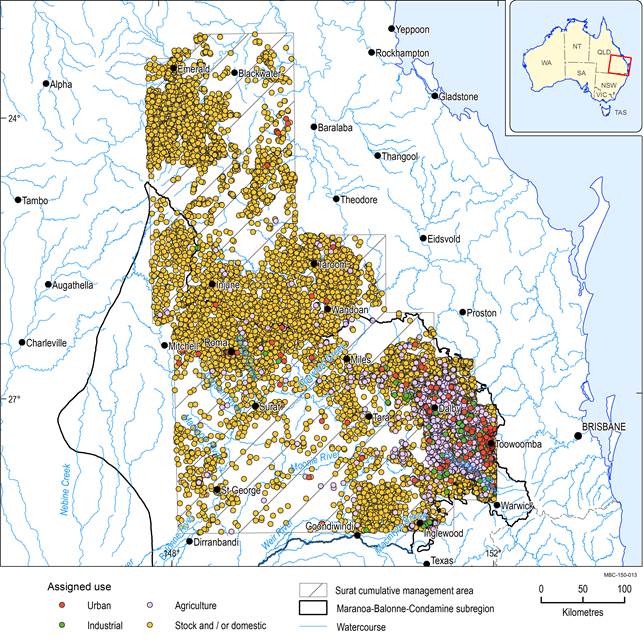
Data: Bioregional Assessment Programme (Dataset 2), Department of Environment and Heritage Protection (Dataset 5)
Groundwater account for petroleum and coal seam gas activities
There are two kinds of petroleum and gas activities in the Surat CMA. These are (i) conventional hydrocarbon production and (ii) CSG production from coal formations. Both conventional petroleum and CSG operations produce water as a by-product of their operations to extract the hydrocarbons, but the amount of water produced in the case of CSG extraction is comparatively large. As of 2012, there were 154 conventional oil and gas wells extracting water from GAB formations (QWC, 2012). The amount of water extracted as part of conventional oil and gas production was estimated at 1.8 GL/year (QWC, 2012). The amount of water produced from individual production wells is generally very small, averaging less than 2.5 ML/year for most fields.
Large amounts of water are extracted from CSG production wells to depressurise coal seams. Groundwater extraction for CSG production in the Surat CMA commenced in 1995. The earliest operations focused on CSG development in the Bowen Basin at the Fairview Field operated by Santos. Groundwater extraction for CSG development commenced in the Surat Basin in 2002.
The volumes of water extracted by petroleum and gas tenure holders including CSG explorers are reported to DNRM. Based on this information, as of December 2013 there were 1534 CSG wells in the Surat CMA (Queensland Government, Dataset 4). Table 5 gives the account of CSG water production from the Surat CMA over the period 2005 to 2013. Clearly, there is an increasing trend in the number of wells over the years, however the half-yearly volume of water produced over the past 5 years was relatively consistent.
Table 5 Half-yearly account of coal seam gas water production from Surat cumulative management area from 2005 to 2013
Data: Queensland Government (Dataset 4)
na = not applicable
1.5.1.2.2 Water management
In Queensland, water sharing plans are called water resource plans (WRP). These are subordinate legislation under Queensland’s Water Act 2000. Surface water catchments define the areal extent of the WRPs except for the Great Artesian Basin (GAB) WRP. The GAB WRP manages the GAB water resources by formation. A number of WRPs partially or fully overlap the Maranoa-Balonne-Condamine subregion: the Border Rivers, Burnett Basin, Condamine-Balonne, Moonie, Moreton and Warrego-Paroo-Bulloo-Nebine catchments and the GAB plan areas.
Groundwater extraction from the alluvial aquifers in the NSW part of the Maranoa-Balonne-Condamine subregion is governed by the NSW Border Rivers Unregulated and Alluvial, NSW Murray-Darling Basin Fractured Rock Groundwater, NSW Great Artesian Basin Groundwater and NSW Great Artesian Basin Shallow Groundwater water sharing plans. The NSW Great Artesian Basin Groundwater and NSW Great Artesian Basin Shallow Groundwater water sharing plan areas are identical, but relate to shallow (<60 m deep) and deep (>60 m deep) GAB groundwater sources. Relevant water resource plans (Queensland Government, Dataset 6) and water sharing plans (NSW Office of Water, Dataset 7) for the Maranoa-Balonne-Condamine subregion are listed in Table 6 and shown in Figure 10.
Table 6 Water resource and water sharing plans relevant for the Maranoa-Balonne-Condamine subregion
WRP = water resource plans, WSP = water sharing plans
Further information on the WRPs and WSPs is available in Section 1.1.4.4 in the companion product 1.1 for the Maranoa-Balonne-Condamine subregion (Welsh et al., 2014).
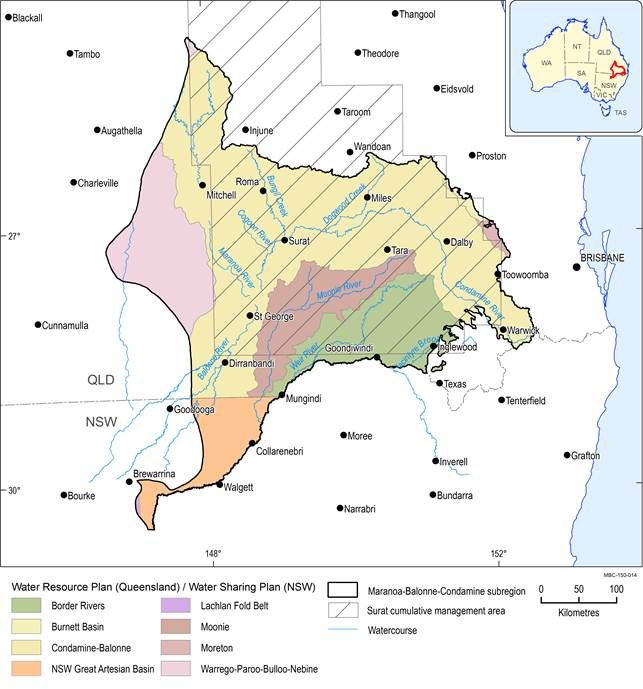
Data: Department of Environment and Heritage Protection (Dataset 5), Queensland Government (Dataset 6), NSW Office of Water (Dataset 7)
In addition, the groundwater systems within the subregion are represented in the Basin Plan for the Murray–Darling Basin as sustainable diversion limits (SDLs). This includes all or part of the Condamine-Balonne, Moonie, New South Wales Border Rivers alluvium, Queensland Border Rivers, and Warrego-Paroo-Nebine groundwater water resource plan areas. The Basin Plan prescribes current limits on extraction based on existing planning regimes as baseline diversion limits (BDL) and the future extraction limits as SDLs. BDLs and SDLs of the groundwater systems are described in Section 1.1.4.4 of the companion product 1.1 for the Maranoa-Balonne-Condamine subregion (Welsh et al., 2014).
1.5.1.2.3 Gaps
Information on stratigraphy and screened intervals were only partially available for estimating groundwater use per aquifer. This information is very important for estimating the impacts as the stresses in different aquifers can have different impacts and hence knowing the aquifers that are actually stressed by the groundwater extraction is important to accurately predict the impacts.
Where actual groundwater use was not recorded, licensed volume was used in estimating groundwater use. Better estimates could be obtained if actual usage data become available.
