Queensland has a surface water quality network of about 240 stations monitoring in situ measurements using manual sampling as well as continuous water quality measurements (167 stations). These measurements generally include electrical conductivity (EC) at 25 °C, temperature, pH, turbidity, nutrients, dissolved oxygen and total alkalinity (DERM, 2012). The manual water sampling frequency for all stations in the subregion is four times a year, except in the Oakey Creek (tributary of the Condamine River), which is sampled 12 times a year (DERM, 2012). The water quality in the three river basins are described in the following sections.
1.5.2.1.1 Water quality in the Condamine-Balonne river basin
Water quality data were collected in the Condamine-Balonne river basin (Figure 4) for a range of water quality markers including total nitrogen, total phosphorus, total suspended solids and many other chemicals, such as cadmium, copper, the herbicides Atrazine and Diuron, and the insecticide Dieldrin (DERM, 2011). In the upper Condamine river basin, nutrient levels were generally within the guidelines at the nutrient monitoring sites as described in DERM (2011). In addition, an ambient surface water quality summary report by the Department of Environment and Resource Management only reports the direction of water quality trends (mostly improving trends) due to data limitations in most Queensland river basins. They note that reporting on magnitude would not be sufficiently reliable or meaningful (DERM, 2011).
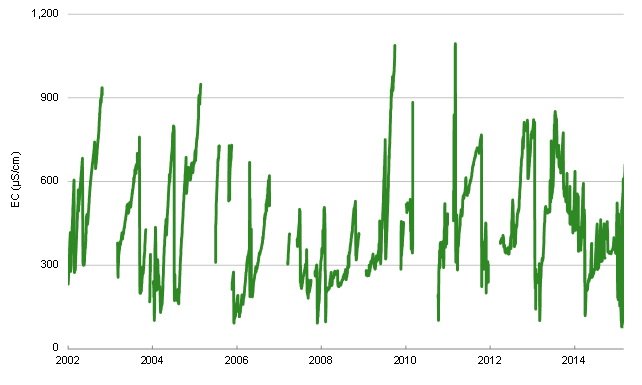
The 20 stations with EC data in the Condamine-Balonne river basin are shown in Table 7. Two examples of EC data in the Condamine-Balonne river basin are shown in Figure 11 and Figure 12 for the period from 1995 to 2015. The data gap shows when data were not collected. This was primarily due to no flow conditions and sometimes due to monitoring equipment failure. EC measured at the Condamine River at Chinchilla (422308C) station ranged from 77 to 1094 µS/cm with a mean of 447 µS/cm. The highest EC values occurred during low flows, which is more saline than in many other rivers in Queensland. EC measured near the outlet of the Condamine-Balonne river basin at the Culgoa River at Whyenbah (422204A) varies between 53 and 584 µS/cm with a mean of 187 µS/cm.
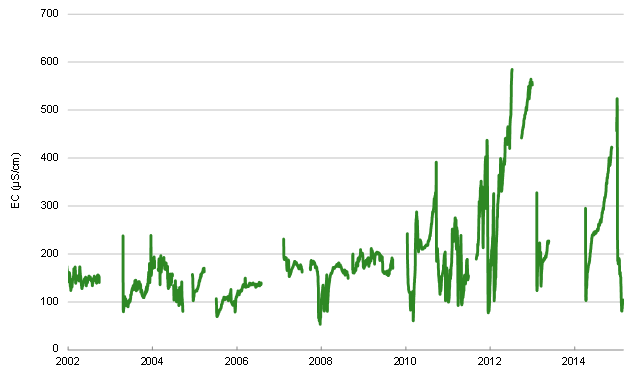
Figure 11 Observed electrical conductivity at gauging station 422204A, Culgoa River at Whyenbah
Data: Queensland Department of Natural Resources and Mines (Dataset 1)
Data: Queensland Department of Natural Resources and Mines (Dataset 1)
Table 7 Gauging stations and monitoring period for electrical conductivity in the Condamine-Balonne river basin
Data: Queensland Government (2015)
1.5.2.1.2 Water quality in the Moonie river basin
The two stations in the Moonie River at Nindigully (417201B) and at Fenton (417204A) as shown in Figure 5 have high concentrations of total nitrogen, which requires management action (DERM, 2011). EC data was only available from the station at the Moonie River at Fenton (417204A) for the period from 2003 to 2015, as shown in Table 8 and Figure 13. The data gap shows when data were not collected. This was primarily due to no flow conditions and sometimes due to monitoring equipment failure. EC measured at the Moonie River at Fenton (417204A) station ranged from 6 to 395 µS/cm with a mean of 143 µS/cm.
Table 8 Gauging stations and monitoring period for electrical conductivity in the Moonie river basin
|
Station number |
Station name and location |
Catchment area (km2) |
Start date |
End date |
|
417201B |
Moonie River at Nindigully |
12,030 |
NA |
NA |
|
417204A |
Moonie River at Fenton |
14,050 |
13 Jan 2003 |
23 Feb 2015 |
Data: Queensland Government (2015) NA means data not available

Figure 13 Observed electrical conductivity at gauging station 417204A, Moonie River at Fenton
Data: Queensland Department of Natural Resources and Mines (Dataset 1)
1.5.2.1.3 Water quality in the Border Rivers river basin
Sites in the Border Rivers river basin (Figure 6) in Queensland are monitored on a monthly basis by the NSW Office of Water on behalf of the Dumaresq Barwon Border Rivers Commission for EC, nutrients, turbidity, total suspended solids and water temperature. Summary statistics are reported for EC, total phosphorus, total nitrogen and turbidity (DBBRC, 2012a). Median salinity in the Border Rivers river basin is below the low salinity guidelines (300 µS/cm) for irrigation water (DBBRC, 2012b). However, Macintyre Brook had salinity levels above the guidelines (350 µS/cm) for protection of aquatic ecosystems in upland streams. Turbidity levels in the Border Rivers river basin showed a gradual increase downstream along the waterway towards Mungindi (DBBRC, 2012b).
Four stations in the Border Rivers river basin had EC data (Table 9). Figure 14 shows an example of auto-sensor EC data in the Border Rivers river basin (station 416202A, Weir River at Talwood) for the period from 2002 to 2015. The data gap shows when data were not collected, especially between 2006 and 2008. This was primarily due to no flow conditions and sometimes due to monitoring equipment failure. EC measured at the Weir River at Talwood (416202A) station ranged from 29 to 471 µS/cm with a mean of 171 µS/cm. DERM (2011) however reports that the streamflow gauging station in the Weir River has insufficient water quality data to assess levels and trends of EC, nitrogen, phosphorus and turbidity. In Macintyre Brook, EC is within the guidelines, whereas data for nitrogen, phosphorus and turbidity are insufficient for meaningful assessment (DERM, 2011).
Table 9 Gauging stations and monitoring period for electrical conductivity in the Border Rivers river basin
|
Station number |
Station name and location |
Catchment area (km2) |
Start date |
End date |
|
416202A |
Weir River at Talwood |
12,070 |
29 Aug 2002 |
26 Feb 2015 |
|
416310A |
Dumaresq River at Farnbro |
1,310 |
12 Mar 2002 |
03 Mar 2015 |
|
416317A |
Broadwater Creek at Barkers |
108 |
21 Mar 1994 |
18 Feb 2015 |
|
416415A |
Macintyre Brook at Booba Sands |
4,092 |
30 May 2002 |
13 Nov 2014 |
Data: Queensland Government (2015)
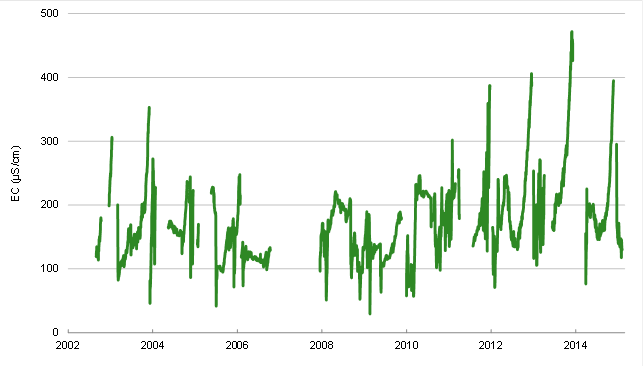
Figure 14 Observed electrical conductivity at the gauging station 416202A, Weir River at Talwood
Data: Queensland Department of Natural Resources and Mines (Dataset 1)
1.5.2.1.4 Gaps
There is a lack of long-term consistent water quality data measurements including EC at 25 °C, water temperature, turbidity, and nutrients within the Maranoa-Balonne-Condamine subregion, especially for the Moonie River and Border Rivers. As a result, the capacity to fully understand the baseline water quality for this area is limited.
