Salinity of groundwater is often expressed in terms of electrical conductivity (EC) in microsiemens per centimetre (µS/cm). To assist with the interpretation of values, sea water is typically around 55,000 µS/cm and water for human consumption not more than about 1,500 µS/cm. The µS/cm post-1985 salinity data for the Hunter subregion have been summarised by aquifer type in Table 16, including number of samples, mean, range and percentage of samples that exceed the different use categories in the guidelines (human consumption, irrigation and stock watering). Classification of bores into alluvial, coastal sands and fractured and porous rock aquifers was based on the method described in 1.5.1.2 . While the coastal sands aquifers have the lowest salinities, the statistics are based on only five samples, so results are not statistically significant. The alluvial aquifers are on average fresher than the fractured rock aquifers, and water is almost always of a quality suitable for irrigation and stock use, although many crop species are sensitive to water salinities below the 8,000 µS/cm threshold and stock can be sensitive to salinities below the 20,000 µS/cm threshold. For example, yields from grapevines, an important crop in the Hunter subregion, start to decline when salinities exceed about 1000 µS/cm, and for lucerne when salinities exceed about 1300 µS/cm (NSW Department of Primary Industries, 2014). Similarly, beef and dairy cattle and horses, which are important stock in the Hunter subregion, can be sensitive to water salinities in the 6000 to 8000 µS/cm range. The maximum value for groundwater salinity of 48,600 µS/cm is high and may be a spurious value or be in different units, but high salinities are certainly associated with water contained within the Permian coal-bearing units and this water has very limited uses.
Table 16 Electrical conductivity (µS/cm) in the Hunter subregion compared to water guidelines
aBased on Australian Drinking Water Guidelines (NHMRC and NRMMC, 2011) and approximate conversion from total dissolved solids (TDS) to electrical conductivity (EC) using conversion factor 0.64. TDS greater than 900 mg/L (~1476 µS/cm) is considered poor quality drinking water.
bBased on Table 4.2.5 in the National Water Quality Management Strategy (ANZECC/ARMCANZ, 2000)
cBased on National Water Quality Management Strategy (ANZECC/ARMCANZ, 2000) and approximate conversion from TDS to EC. TDS greater than 13,000 mg/L (EC of ~20,000 µS/cm) is the maximum concentration when a decline in health of all stock would be expected (ANZECC/ARMCANZ, 2000, Table 4.3.1)
Data: NSW Office of Water (Dataset 1)
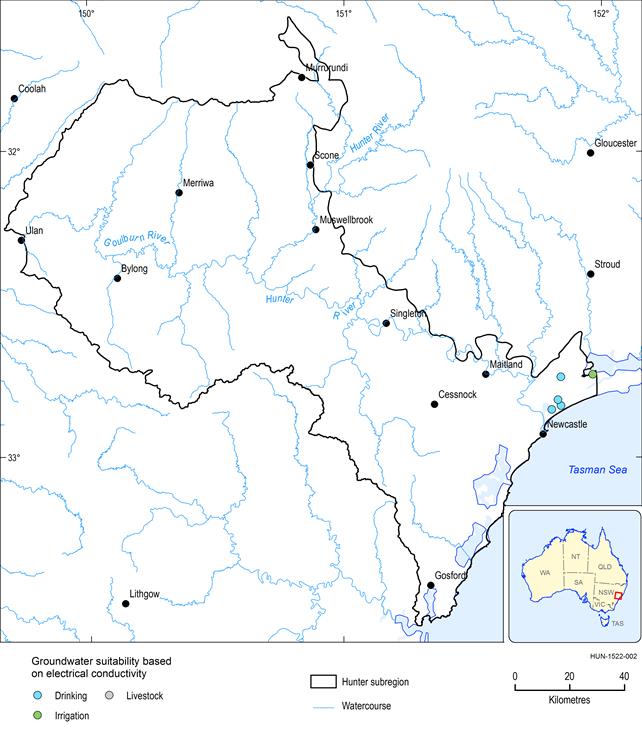
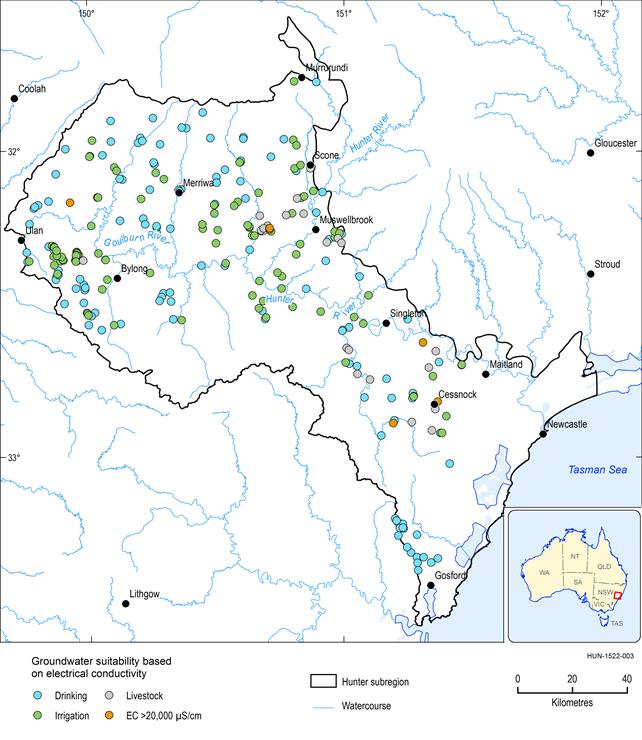
The EC data have been mapped by alluvial, coastal sands and fractured rock aquifer types in Figure 19, Figure 20 and Figure 21, respectively. No strong spatial patterns are evident from the mapped data. There appears to be more saline groundwater within the alluvial aquifers around Singleton, north of Muswellbrook and in the lower Goulburn. EC data for the coastal aquifers in Figure 20 are localised, and indicate that the groundwater aquifer north of Newcastle contains relatively fresh water. Some localised areas of higher groundwater salinity levels are evident in the fractured rock aquifers.
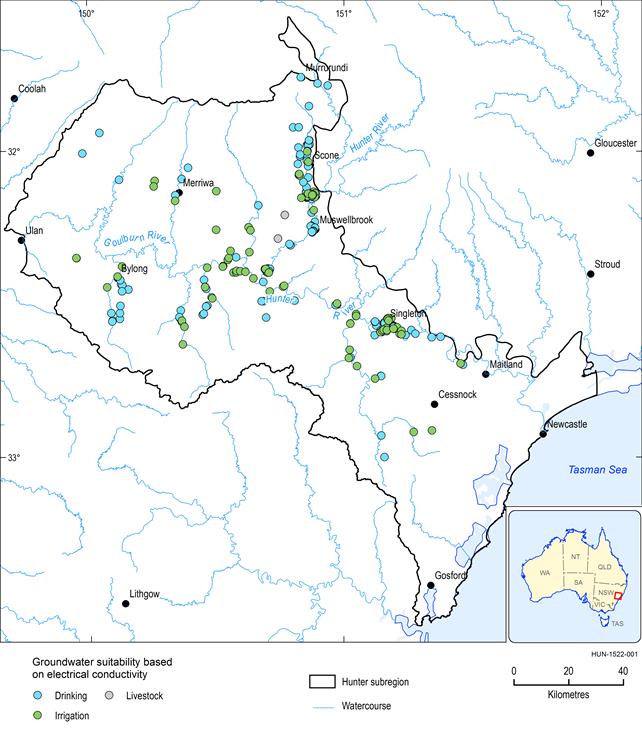
Data: NSW Office of Water (Dataset 1, Dataset 2)