The salinity of water in the Hunter River and its tributaries varies considerably, with some of the tributaries having very good quality water and others having relatively high salt concentrations. The dominant source of salts in the Hunter river basin are the Permian sedimentary rocks, which were deposited by a series of marine transgressions and therefore have a high salt content. Where the main corridor of the Hunter River valley has eroded into these Permian rocks, surface and groundwater discharges to the Hunter River have contributed to naturally high salinity levels.
Other lesser sources of river salinity in the Hunter river basin (Environment Protection Authority, 2013) include rainfall, atmospheric deposition, runoff and infiltration.
Recent changes in land cover and use in the river basin may have contributed to rising groundwater levels in some areas and an increase in the discharge of salt to streams (Environment Protection Authority, 2013). These anthropogenic land use changes include coal resource development (e.g. areas cleared of vegetation, service roads, and site processing facilities), power generation and agriculture. In particular, there has been concern in the community about the impact of mine water discharges on stream salinities in the Hunter River and implications for other users of river water. Crops vary considerably in their tolerance to saline water, but most crops can use water which has an EC value of up to about 700 µS/cm without loss of yield. However, for grapevines, an important commodity in the Hunter subregion, the threshold beyond which yields start to decline is about 1000 µS/cm; yields for lucerne start to decline at about 1300 µS/cm (NSW Department of Primary Industries, 2014a).
The Hunter River Salinity Trading Scheme (HRSTS) was introduced in 1995 to manage saline discharges from industry in the Hunter Regulated River downstream of Glenbawn Dam to Singleton. Under the scheme, industries are permitted to discharge industrial water to the river in a way that maintains the salinity of the river within acceptable limits. Thus, when the river is in low flow, no discharge is allowed; when the river is in high flow, limited discharge is allowed; and when the river is in flood, unlimited discharge is allowed. The total volume of salt permitted to be discharged by those in HRSTS is capped at 1000 salt discharge credits. Credits can be traded among licence holders. This gives each licence holder the flexibility to increase or decrease their allowable discharge from time to time. The impacts of HRSTS on stream salinities are not the focus of this section. A recent report by the Environment Protection Authority (2013) suggested that the scheme has had little impact on stream salinities.
The section provides:
- details of salinity data available in the Hunter river basin from continuous monitoring at gauging stations (Bioregional Assessment Programme, Dataset 1)
- an overview of stream salinities across the Hunter subregion
- a more detailed look at salinities in the regulated Hunter River through analysis of salinity data from three sites along the Hunter River (Denman, Glennies Creek, Singleton).
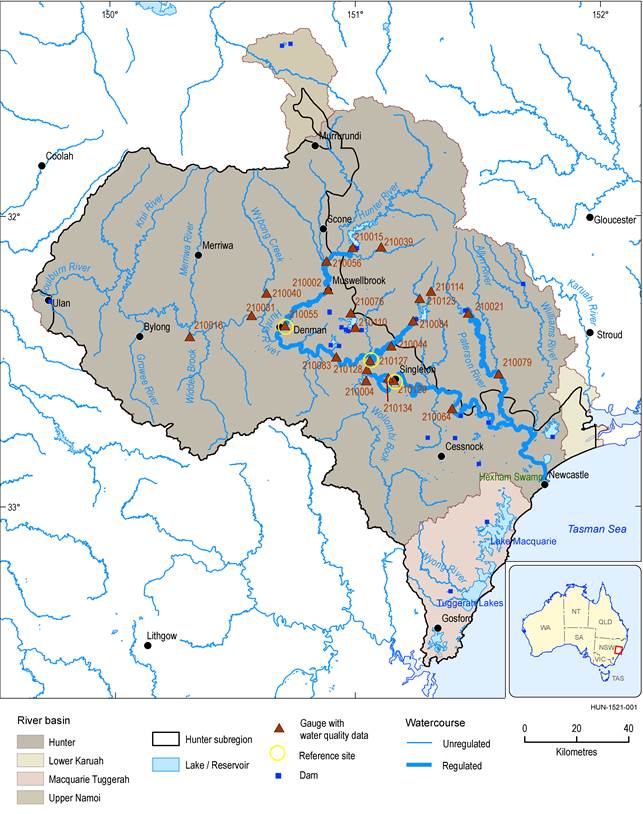
There are 23 gauging stations which have more than 10 years of river salinity data in the Hunter river basin. Table 13 summarises the gauging stations and dates where EC levels are recorded at 15-minute intervals by DPI Water. The locations of these monitoring stations are shown in Figure 12.
Table 13 Gauging stations and period for which electrical conductivity data are available for the Hunter subregion
Bold font indicates reference gauging stations used for monitoring impacts of the Hunter River Salinity Trading Scheme.
aEnd dates are not always indicative of end of records, but of cut-off dates for inclusion in published datasets.
D/S = downstream of; U/S = upstream of
Data: Bioregional Assessment Programme (Dataset 1)
Data: Bioregional Assessment Programme (Dataset 2, Dataset 3, Dataset 4, Dataset 5)
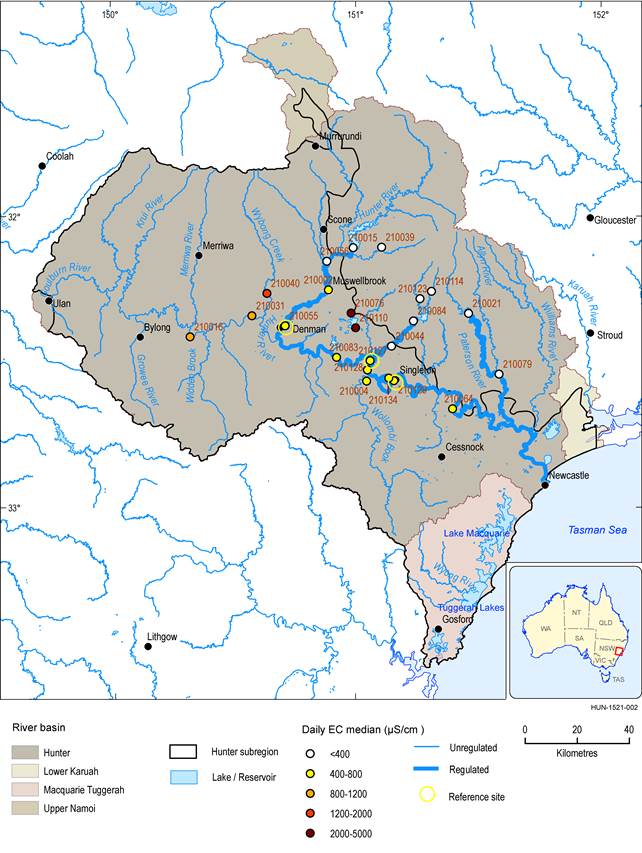
Figure 13 shows the spatial distribution of median daily EC at the 23 gauges. For the Hunter River’s northern tributaries, which feed into Glenbawn, Glennies Creek and Lostock storages, water quality is good and suitable for all uses, with median daily EC less than 400 µS/cm. Along the regulated section of the Hunter River median river salinities are higher, but within the 400 to 800 µS/cm range, which means the water is fit for most uses. Water entering the Hunter River from the Goulburn River in the western part of the river basin tends to be of lower quality with potentially some limitations on its use. Median salinities at gauging stations 210016 and 210031 on the Goulburn River are between 800 and 1200 µS/cm, and at gauging station 210040 on Wybong Creek, a tributary to the Goulburn River, in the 1200 to 2000 µS/cm salinity range. Streamflow in Wybong Creek is relatively low, but the Goulburn River contributes a significant volume to the Hunter River and would contribute to the increase in Hunter River salinities between Muswellbrook and Singleton. The highest stream salinities are recorded at two gauges (210076 and 210110) in the vicinity of Lake Liddell, with median daily ECs exceeding 2000 µS/cm.
Data: Bioregional Assessment Programme (Dataset 2, Dataset 3, Dataset 4, Dataset 5, Dataset 6)
