1.1.4.2.1 Alluvial aquifers
Shallow groundwater levels are shown on Figure 23 for the shallow alluvium in the subregion and surrounds. Shallow groundwater flows, with the exception of the Condamine Alluvium, are generally topographically driven with lateral flow directions similar to that of major drainage. In addition, Figure 23 identifies areas of potential inter-formational flow from alluvial aquifers into the GAB formation, where water levels in the alluvium are higher than in the uppermost GAB formations. Conversely, where heads in the uppermost GAB aquifer are higher than the alluvium, there is potential for upward flow, provided the saprolite aquitard on top of the GAB sediments is breached or absent. Based on current knowledge, this condition is only satisfied in the Dirranbandi paleochannel, the Namoi paleochannel and possibly in the deepest (eastern) section of the Condamine River Valley.
Condamine Alluvium
High levels of groundwater development and extraction within the Condamine Alluvium and tributaries have resulted in a significant decline in groundwater levels over most of the area (Figure 24), with local pockets of groundwater level rise in the north and central east of the Condamine river basin (Kelly and Merrick, 2007). Hillier (2010) reported groundwater levels recorded in selected bores between the mid 1960s and the early 2000s, all of which show an overall decline. The decline in groundwater levels has resulted in large groundwater depressions, one about 20 km to the east of Cecil Plains and another centred around Macalister, that have significantly altered pre-development flow directions. CSIRO (2008) indicate that recharge to the Condamine Alluvium is via rainfall infiltration throughout the Condamine river basin, flood recharge in the lower areas, lateral flow from adjacent upstream aquifers and upward leakage from the basalts of the Main Range Volcanics Formation. Non-flood streambed leakage from the Condamine River is considered to be the largest source of recharge to the alluvium (Huxley, 1982), with additional contributions from irrigation water via deep drainage.
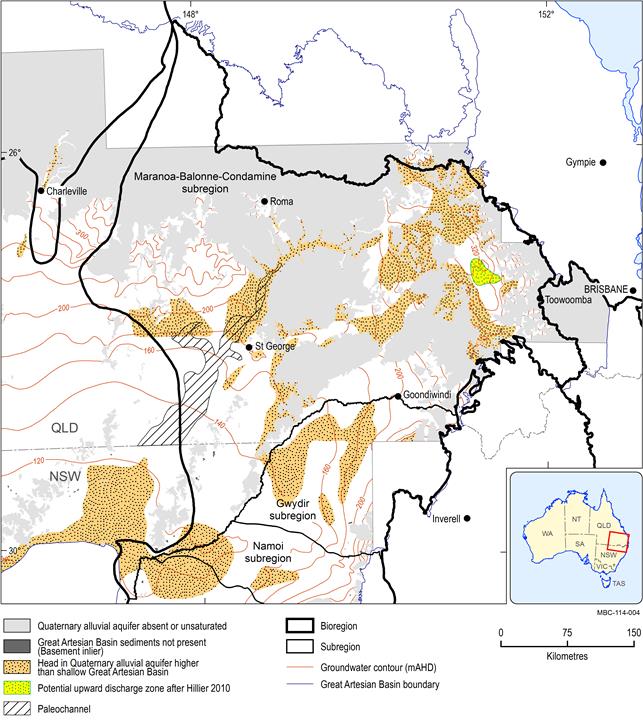
Source data: modified from Kellett and Stewart (2013) with paleochannel outline from Kellett et al. (2006) and potential upward discharge zone from Hillier (2010) Hatched area represents the location of the deep alluvial aquifer within the Dirranbandi paleochannel in Queensland. Potential upward discharge zone is from the Walloon Coal Measures to the Condamine Alluvium.
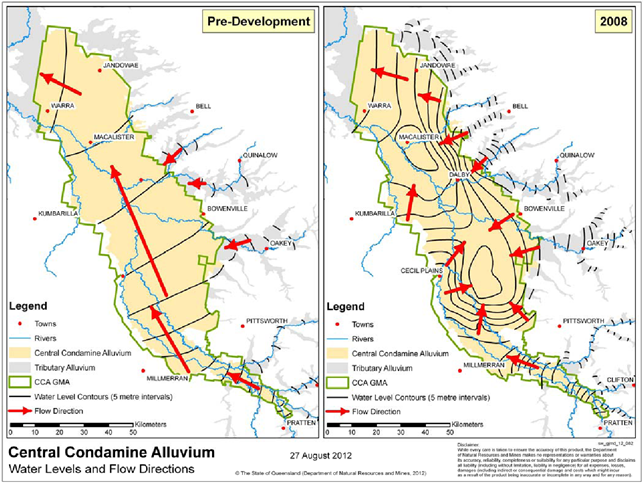
Figure 24 Effect of groundwater developments on groundwater levels and flow directions
Source: Figure 2 in Department of Natural Resources and Mines (2012)
Border Rivers Alluvium
Useable groundwater is restricted to sediments deposited in a narrow valleys associated with the Dumaresq and Macintyre rivers and the Macintyre Brook. The valley broadens downstream of Keetah Bridge where groundwater generally becomes too saline for use.
An unconfined Narrabri Formation aquifer (10 to 30 m thick) and deeper, confined Gunnedah Formation aquifer (up to 70 m thick) are identified in this area. The coarser sediments of the Gunnedah Formation form a paleochannel that meanders through the valley fill (CSIRO, 2007).
The Gunnedah Formation aquifers fine upward into Gunnedah Formation clays of variable permeability that are between 2 and 15 m thick and separate the aquifers from those of the Narrabri Formation (CSIRO, 2007).
CSIRO (2007) indicate that recharge to the Narrabri Formation is mostly from stream losses, with minor contributions from rainfall and excess irrigation, with recharge to the deeper Gunnedah Formation being mostly via cross-formational flow and upward leakage from underlying GAB aquifers. However recharge from the Dumaresq River and Macintyre Brook are not strongly manifested in the groundwater surface (see Figure 23) which generally suggests either no interaction with streams or discharge to them in many areas (although the area near Goondiwindi is an exception where mounding is evident in the groundwater surface which has been attributed to local hydraulic loading by the town weir). There is evidence for some upward leakage from the underlying Surat Basin in this area as outlined in the section on groundwater quality in Section 1.1.4.3 .
Milne-Home et al. (2007), showed that although average water levels in the Border River Alluvium fell by about 2.5 m in the east near Yelarbon from 1990 to 2005, they increased in the west by about 2.5 m south of Goondiwindi, suggesting that the water resource is not highly stressed
St George Alluvium
Kellett et al. (2006) provide a detailed description of the St George Alluvium including water level and flow direction maps for both the shallow and deep alluvial aquifers between about 75 km north of St George to the Queensland – NSW border. They report that groundwater flow directions in the shallow alluvial aquifer are mainly north to the south-west, and radially outward along the axis of the Balonne River north of Whyenbah. Further, groundwater flow in the deeper alluvial aquifer is from north-east to south-west, parallel to the axis of the Dirranbandi paleochannel. Water levels in the deeper aquifer are lower than in the shallow aquifer.
Water levels in the upper alluvial aquifer, during the period 1998 to 2004, remained stationary over most of the subregion with the exception of irrigation areas in the vicinity of St George where: groundwater mounding occurred in the shallow alluvial aquifer within the St George Irrigation Area, about 20 km south-east of St George, due to infiltration of excess irrigation water; an overall decline in groundwater levels in the deeper alluvial aquifer occurred, within the groundwater irrigation area, about 30 km north-west of St George (Kellett et al., 2006).
Groundwater recharge to the shallow alluvium occurs via multiple mechanisms, namely river flooding recharging sandy floodplain sediments, natural river bed leakage from the Maranoa and Balonne rivers upstream of St George, the Balonne River north of Whyenbah and local recharge via the Narran and Culgoa rivers, and artificial recharge via infiltration of excess irrigation water in the St George Irrigation Area and groundwater irrigation area (Kellett et al., 2006).
Groundwater recharge to deep alluvial aquifers is via bed underflow from the Balonne River upstream of Beardmore Dam where the aquifer is unconfined, and leakage from the shallow alluvial aquifer in the groundwater irrigation area (Kellett et al., 2006).
1.1.4.2.2 Fractured rock aquifers
Main Range Volcanics Formation
Basalt aquifers of the Main Range Volcanics Formation generally exhibit relatively dynamic and rapid water level variations in response to rainfall recharge and pumping events, and natural depletion. Recharge is via direct rainfall infiltration and river leakage.
Barnett et al. (2004) assessed water level changes for the period 1990 to 2000 as well as seasonal variations, concluding that the trend of water levels in the Main Range Volcanics Formation has close correlation with rainfall and in general does not indicate either a rising or falling trend. The dynamic nature of the groundwater system is evident in bores with seasonal water level variations of 1 to greater than 3 m and (in some cases) water level variations in the order of 11 m between periods of high rainfall and drought.
1.1.4.2.3 Surat Basin
Groundwater level contours for water in the uppermost units of the Surat Basin, presented by Kellett et al. in Smerdon and Ransley (2012), are shown in Figure 25. The water levels mostly represent water in the areas of outcrop of all the GAB aquifers (intake beds) and aquitards along the western slopes of the Great Dividing Range. Water then passes into the Rolling Downs Group (Figure 21) which abuts the intake beds and dips gently basinward to the south-west. The groundwater surface tends to be topographically controlled.
Groundwater recharge mostly occurs along the southern and eastern edge of the GAB via rainfall and streamflow, in an area known as the ‘intake beds’. The intake beds outcrop in the east and north of the Maranoa-Balonne-Condamine subregion.
From the intake beds, groundwater levels are commensurate with general flow to the south and south-west.
The groundwater gradients between the Surat Basin and overlying alluvium indicate potential for upward leakage to the alluvial deposits in parts of the subregion, except for the locations shown on Figure 25 where the groundwater level in the alluvium is higher.
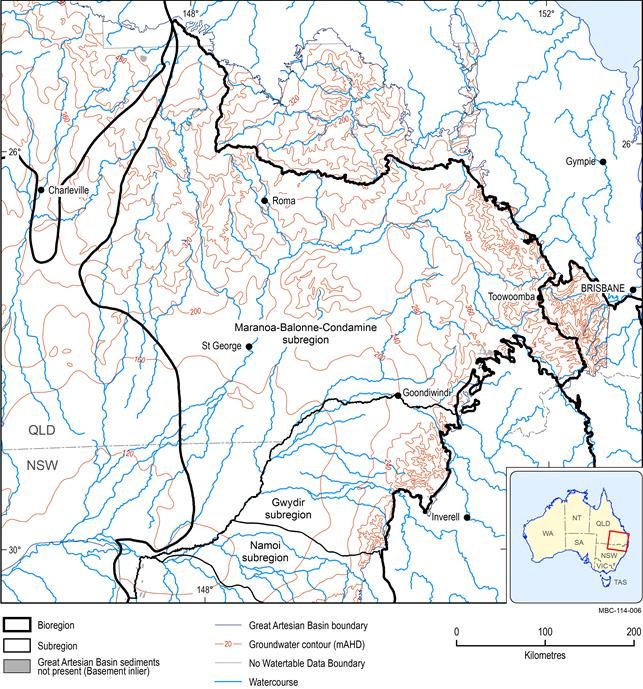
Figure 25 Groundwater level contours for the upper units of the Surat Basin
Source data: derived from data presented in Figure 5.19 in Ransley and Smerdon (2012)
1.1.4.2.4 Inter-aquifer connectivity
As outlined in preceding sections, while the alluvium in the south of the subregion near the Border Rivers is typically separated, in the literature, into the overlying Narrabri Formation and underlying Gunnedah Formation, the contact between them is difficult to determine lithologically in places and some authors question the validity of this separation. Some degree of hydraulic connectivity is often reported between the aquifers of both formations (e.g. Carr and Kelly, 2010), with leakage from the Narrabri Formation commonly cited as a source of recharge to the Gunnedah Formation aquifers.
Kellett and Stewart (2013) indicate that intense weathering of exposed GAB rocks prior to deposition of overlying alluvium resulted in development of a basin-wide saprolite layer. This layer has a low permeability basal portion that is considered to reduce connectivity with overlying systems. Kellett and Stewart (2013) state that in some places the saprolite has been removed by erosion making hydraulic connection possible. Such areas occur beneath paleochannels of which there are reportedly many in the Surat Basin, commonly occurring beneath or next to modern stream channels. Depending on the relative groundwater levels between the alluvium and GAB, there may be upward or downward flow of water in these areas (see Figure 23).
In the Maranoa-Balonne-Condamine subregion, Kellett and Stewart (2013) indicate that areas where downward flow of water from the alluvium to the underlying GAB is highly likely include:
- the Condamine-Balonne River from Macalister to Beardmore Dam
- the Condamine River (South Branch) from Millmerran to Cecil Plains
- the Balonne River from Blue Lagoon to Whyenbah.
Areas where Kellett and Stewart (2013) indicate that groundwater flow from the GAB to the overlying alluvium in is highly likely in the subregion include:
- the Border Rivers (Macintyre and Dumaresq rivers and Macintyre Brook) upstream of Goondiwindi (there is evidence of upward recharge in groundwater chemical data near the Peel Fault zone in this area, as outlined in Section 1.1.4.3)
- the Dirranbandi Paleovalley from St George to Hebel
- the Condamine River (North Branch)/Oakey Creek from Brookstead to Macalister.
Two recent studies have focused on the question of groundwater flow between the Walloon Coal Measures and the Condamine Alluvium. The first, by Hillier (2010), was limited in scope to the Dalby-Millmerran-Oakey region and found that water levels in the alluvium, in the western Oakey Creek Valley (south of Dalby) and in the Condamine River Valley, are lower than those in the underlying Walloon Coal Measures of the GAB. Hillier (2010) concluded that while there was therefore potential for flow from the Walloon Coal Measures to the alluvium, if pressures in the Walloon Coal Measures were reduced due to coal seam gas extraction, potential flow directions could be reversed, inducing flow away from the alluvium (Figure 23). The second, more extensive, study by the Office of Groundwater Impact Assessment (2013) analysed the hydrogeochemistry of aquifers in the Condamine Alluvium footprint. It found no evidence of connection between the Walloon Coal Measures and Condamine Alluvium. The study concluded that based on the available data, the hydraulic connectivity between the Condamine Alluvium and Walloon Coal Measures is likely to be low. The GAB aquifers adjacent to the Walloon Coal Measures comprise the Springbok Sandstone above, and the Hutton and Marburg sandstones below.
Across most of the subregion, the Walloon Coal Measures appear (for the most part) to be hydraulically isolated above and below by low permeability aquitard layers. The area of the Condamine Alluvium, where the Walloon Coal Measures sub-crop, is an exception. The aquitard layer above the productive coal seams of the Walloon Coal Measures is typically 15 m thick. However, in parts of the north-eastern Surat Basin, this aquitard is absent and a higher degree of interconnectivity is expected (QWC, 2012). The aquitard beneath the Walloon Coal Measures is about 45 m thick (QWC, 2012). QWC (2012) report that while there are historically little water level monitoring data for the Walloon Coal Measures and surrounding aquifers at some locations, a difference in water levels, prior to coal seam gas development, existed between the Walloon Coal Measures and adjacent aquifers, which suggests limited interconnectivity.
Within the Surat Basin, little is understood about the extent and influence of geological structures such as faults and fractures and the role they may play as conduits for interconnectivity between formations. The Queensland Office of Groundwater Impact Assessment has identified research into the interconnectivity between the Walloon Coal Measures and adjacent aquifers in the Surat Basin as a priority (QWC, 2012).
A methodology to assess the risks to groundwater associated with coal seam gas development in the Surat Basin and southern Bowen Basin has been developed for the Queensland Department of Natural Resources and Mines (Worley Parsons, 2013). The study considered the risk to aquifer storage in aquifers above and below the Walloon Coal Measures and concluded that there is a relatively high risk for the Lower and Upper Springbok Sandstone, Hutton Sandstone and Gubberamunda Sandstone in locations to the east of Roma, west and southwest of Chinchilla and west of Dalby, within the Surat Basin (Worley Parsons, 2013).
A preliminary desktop assessment of the potential for hydraulic connectivity between the GAB and underlying basins was undertaken as part of the Great Artesian Basin Water Resource Assessment (CSIRO, 2012). Connectivity can occur where aquifers, partial aquifers and leaky aquitards are juxtaposed below and above the base of the GAB (noting that faults may also act as conduits in places through otherwise low permeability formations). Figure 26 shows that hydraulic connectivity between the GAB and underlying formations is likely to be relatively poor across much of the subregion. Local exceptions include the area west of St George; several areas east, north and west of Roma; and a narrow band stretching northward from the area north-west of Moonie. In these locations, the Surat Basin has a heightened potential connectivity with the underlying Bowen Basin strata.
It is emphasised that relative hydraulic heads and thus potential flow directions are not fixed and might change over time in response to stresses such as groundwater extraction (e.g. for irrigation or coal seam gas development).
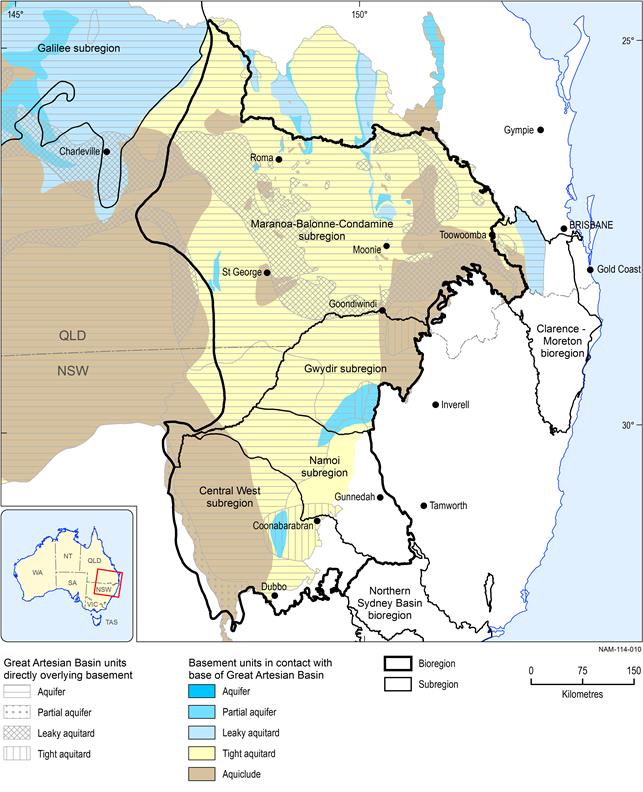
Source data: derived from data presented in Figure 5.7 in CSIRO (2012)
