The impact and risk analysis (Herron et al., 2018c) investigated how hydrological changes due to additional coal resource development may affect water-dependent assets, such as bores, wetlands or heritage sites.
More than 2200 water-dependent assets listed in the asset register (Dataset 10; Bioregional Assessment Programme, 2017; Macfarlane et al., 2016) were analysed for the subregion (Table 2). They include:
- 1652 ecological assets, encompassing
- the Ramsar-listed Kooragang Nature Reserve and Shortland Wetland
- 17 wetlands including Lake Macquarie, Tuggerah Lake and Colongra Swamp
- 6 threatened ecological communities
- 7 Important Bird Areas
- potential habitats of 105 flora and fauna species listed in the Commonwealth’s Environment Protection and Biodiversity Conservation Act 1999 (EPBC Act)
- 249 economic assets, including water source areas such as the Hunter Regulated River water source and associated water rights
- 307 sociocultural assets, including 275 heritage sites, 9 Indigenous sites and 23 recreation areas.
Potential impacts on most water-dependent assets were assessed by overlaying their extent on the zone of potential hydrological change (Figure 8). The assessment took a precautionary approach: it identified potential impacts if an asset or any part of it is within the zone.
Ecological changes were not predicted for assets, because receptor impact models (Box 8) were developed for landscape groups and not individual assets. However, an example of a more detailed analysis of a specific asset (‘potential distribution of Malleefowl (Leipoa ocellata)’) is provided in Herron et al. (2018c) to illustrate the type of approach that could be undertaken to assess impacts at a finer level of detail.
The greatest confidence in regional hydrological modelling results is in those areas that are very unlikely to be impacted. Where potential impacts have been identified, further local-scale modelling may be required to determine the likelihood and magnitude of impacts.
Table 2 Water-dependent assets in the assessment extent and the zone of potential hydrological change
Economic asset numbers are not individual bores but water access entitlements that could include one or multiple bores or water rights. Potential impacts on water-dependent assets were assessed by overlaying their extent on the zone of potential hydrological change.
Data: Bioregional Assessment Programme (Dataset 10), Bioregional Assessment Programme (2017)
Ecological assets
Which ecological assets are very unlikely to be impacted?
Of the 1652 ecological water-dependent assets in the Hunter assessment extent, 921 water-dependent assets, or 56%, are outside the zone of potential hydrological change and thus are very unlikely to be impacted by hydrological changes.
The two Ramsar-listed wetlands, Kooragang Nature Reserve and Shortland Wetland, are outside the zone of potential hydrological change, and are very unlikely to be impacted due to additional coal resource development.Key finding 8
Other assets outside the zone and very unlikely to be impacted include:
- the Brisbane Water and Hunter Estuary important bird areas
- potential habitats of 16 species listed under the EPBC Act or NSW’s Threatened Species Conservation Act, including 11 plant species, 3 bird species, the Booroolong frog and the beady pipefish
- Ginger Beer, Parnell, Wappinguy and Wild Bull springs
- 48 parks and reserves, including Brisbane Water National Park, Camerons Gorge Nature Reserve, Hunter Wetlands National Park and Karuah National Park.
The critically endangered Wollemi Pine, which has a potential species distribution of 137 km2 in the zone, is considered unlikely to be impacted because it is a rainforest species and not dependent on groundwater.
See Section 3.5.2 of Herron et al. (2018c) for more details.
Which ecological assets are potentially impacted?
Groundwater-dependent ecosystems and potential habitats of species make up nearly 90% of the ecological assets found in the zone of potential hydrological change.
Potentially impacted EPBC Act-listed species include iconic species, such as the regent honeyeater, swift parrot and koala. Three state-listed species (green-thighed frog, red-crowned toadlet and wallum froglet) all have extensive potential habitats within the zone. Some species – including migratory species, such as the black-faced monarch, cattle egret, fork-tailed swift, great egret and satin flycatcher – have very large potential habitat distributions that cover most, or all, of the zone and are found in a variety of landscape classes beyond the potentially impacted classes. All potentially impacted potential habitats of species had less than 50% of their area that lies within the assessment extent also within the zone of potential hydrological change.
Three Important Bird Areas in the zone overlap with potentially impacted groundwater-dependent ecosystems:
- 1.5 km2 of the 134 km2 of the Greater Blue Mountains Important Bird Area in the zone is associated with forested wetlands.
- 5.0 km2 of the 112 km2 of the Lake Macquarie Important Bird Area in the zone is associated with wet and dry sclerophyll forests and 3.8 km2 with forested wetlands.
- 10.1 km2 of the 395 km2 of the Mudgee-Wollar Important Bird Area in the zone is associated with forested wetlands and 1 km2 with wet and dry sclerophyll forests.
Five areas in the Collaborative Australian Protected Area Database overlap with potentially impacted groundwater-dependent ecosystems, including 3.6 km2 of the 54 km2 of the Hinterland Spotted Gum Endangered Ecological Community, which is associated with 1.3 km2 of wet and dry sclerophyll forests and 1.5 km2 of forested wetlands.
Economic assets
Economic water-dependent assets are made up of surface water and groundwater sources and their associated water access licences and basic water rights, and water supply infrastructure.
Which economic assets are very unlikely to be impacted?
Fifteen unregulated and alluvial water sources are outside the zone of potential hydrological change and are very unlikely to be impacted.
Four groundwater sources, namely the Liverpool Ranges Basalt Coast groundwater source and the Stockton, Tomaree and Tomago water sources, do not intersect the zone and are therefore also very unlikely to be impacted.
Mardi Dam and Grahamstown Dam are outside the zone and natural inflows are unlikely to be impacted. However, Mardi Dam is filled by pumping water from Wyong River and Ourimbah Creek, so the extent to which additional coal resource development impacts streamflow in Wyong River, water supply to Mardi Dam could be affected.
See Section 3.5.3 of Herron et al. (2018c) for more details.
Which economic assets are potentially impacted?
Following the rule-out process, five groundwater sources and 19 unregulated and alluvial water sources were identified as being potentially impacted by additional coal resource development.
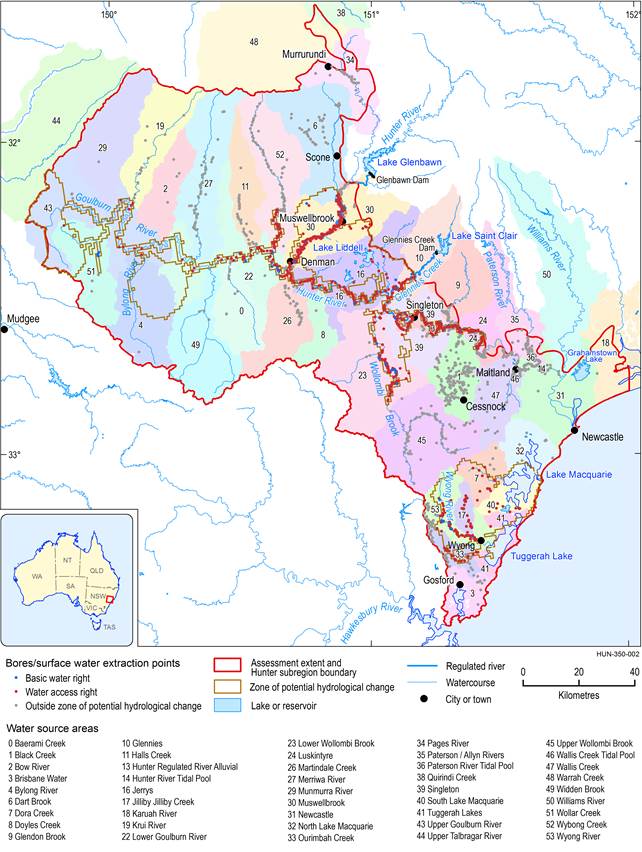
There are 3831 water supply bores and surface water extraction points in the zone that are potentially impacted (Figure 14).
Impacts on economic assets were assessed in terms of changes in water availability, reliability of supply and potential for invoking ‘make good’ provisions under the NSW Aquifer Interference Policy (NSW Office of Water, 2012).
Changes in mean annual water availability in the Hunter Regulated River at Greta are very likely to exceed 5 GL per year (less than 1% of mean annual flow), but very unlikely to exceed 12 GL per year (approximately 1.6% of mean annual flow) over the period from 2013 to 2042.Key finding 9
This reduction in water availability is indicated by the change in mean annual flow. Flow reductions in the regulated river can be managed through increasing the volume of water released from Glenbawn and Glennies Creek dams to meet environmental water requirements, which could have an impact on available water determinations for consumptive users.
In the Singleton, Muswellbrook, Jerrys and Wyong River water source areas, reductions of 0.2 to 2.9 GL per year are very likely, and it is very unlikely that these reductions will exceed 3 to 6 GL per year.
Change in the the number of cease-to-pump days per year due to additional coal resource development was used as an indicator of impacts on reliability of supply. ‘Cease-to-pump’ rules attach to most water sources in NSW to ensure sufficient water is retained in unregulated rivers to meet environmental requirements. Potentially significant changes are possible for the Wyong River and some creeks in the Singleton, Jerrys and Muswellbrook water source areas. In all these water source areas, the modelled results show a highly varied response. In the Wyong River, this ranges from a 5% chance that there is no impact on cease-to-pump days, a 50% chance of 8 additional cease-to-pump days and a 95% chance of fewer than 145 additional cease-to-pump days (Section 3.5.3.3.2 in Herron et al. (2018c)). Incorporating local-scale hydrogeological information into the analysis for the Wyong river basin (which was carried out in only this basin) reduced the magnitude of this change substantially.
Data: Bioregional Assessment Programme (Dataset 7, Dataset 8, Dataset 11)
Bores where ‘make good’ provisions might apply
It is very likely that groundwater drawdowns due to additional coal resource development will exceed 2 m at 13 water supply bores. The number of water supply bores where drawdown exceeds 2 m is very unlikely to be more than 170.Key finding 10
The NSW Aquifer Interference Policy specifies minimal impact thresholds for highly productive and less productive groundwater sources in NSW. Generally, if drawdown from activities that interfere with aquifers exceeds 2 m, then ‘make good’ provisions should apply, unless it can be demonstrated to the Minister’s satisfaction that the variation will not prevent the long-term viability of GDEs or culturally significant sites nearby.
Of the 13 bores where it is very likely that groundwater drawdown will exceed 2 m, 7 are water access licences, 3 are basic water rights, and 3 fall in the mine pit exclusion zone. All 13 bores are on mining leases.
Of the 170 bores where drawdown greater than 2 m is possible, 50 are within the mine pit exclusion zone where drawdown estimates are uncertain but highly likely, and a further 109 are on mine lease areas. It is very unlikely that more than 11 non-mining use water supply bores in the Sydney Basin – North Coast groundwater source (7) and Jilliby Jilliby Creek (2), Tuggerah Lakes (1) and South Macquarie Lake (1) water sources would exceed the ‘make good’ provisions threshold; there is a 50% chance that there are fewer than five.
Sociocultural assets
Which sociocultural assets are very unlikely to be impacted?
Of the 307 sociocultural assets in the Hunter assessment extent, 240 are outside the zone of potential hydrological change and it is thus very unlikely that they will be affected by hydrological changes due to additional coal resource development.
Almost 140 km2 of the 10,000 km2 of the Greater Blue Mountains World Heritage Area are in the zone of potential hydrological change, of which 99% is native vegetation in non-groundwater-dependent ecosystems, and therefore not sensitive to changes in groundwater and not expected to be impacted.Key finding 11
About 1.5 km2 of the Greater Blue Mountains World Heritage Area within the zone coincides with potentially impacted forested wetlands.
Which sociocultural assets are potentially impacted?
There are 67 water-dependent sociocultural assets within the zone of potential hydrological change; 45 of these are built infrastructure and 22 are reserves or national parks. The Bioregional Assessment Programme does not have the expertise to comment on potential impacts of changes in hydrological regimes on built infrastructure. The reserves and national parks overlap with 13 km2 of potentially impacted groundwater-dependent ecosystems and 84 km of potentially impacted permanent or perennial streams.
See Section 3.5.4 of Herron et al. (2018c) for more details.
Explore potential impacts on water-dependent assets in more detail on the BA Explorer, available at www.bioregionalassessments.gov.au/explorer/HUN/assets Description of the water-dependent asset register, product 1.3 (Macfarlane et al., 2016) Water-dependent asset register (Bioregional Assessment Programme, 2017) Impact and risk analysis, product 3-4 (Herron et al., 2018c) Compiling water-dependent assets, submethodology M02 (Mount et al., 2015) Impacts and risks, submethodology M10 (Henderson et al., 2018) Asset database (Dataset 10) Impact and risk analysis database (Dataset 1)FIND MORE INFORMATION
