Potential hydrological changes due to additional coal resource development were modelled using regional-scale surface water and groundwater models. Potential impacts due to additional coal resource development are limited to the zone of potential hydrological change (Figure 1 and Box 4).
The zone of potential hydrological change covers an area of 3213 km2 (19% of the assessment extent) and includes 1228 km of streams (8% of streams in the assessment extent).Key finding 2
Groundwater
The area with at least a 5% chance of at least 0.2 m of drawdown is 2441 km2 for additional coal resource development (Figure 8) and 4307 km2 for the baseline (Figure 9). The area of overlap (1879 km2) potentially experiences cumulative groundwater impacts due to baseline and additional coal resource developments.Key finding 3
Results from regional-scale groundwater modelling indicate that drawdown (Box 3) of greater than 0.2 m due to the additional coal resource development in the subregion is very likely to occur at distances of up to 5 km from mine sites and very unlikely to occur at distances exceeding 20 km.
Groundwater model results indicate that additional drawdown greater than 5 m is very likely at Bylong, Mandalong, Ulan and Mount Arthur mine sites (Figure 17 and Figure 19 in Herron et al. (2018c)). Additional drawdown exceeding 5 m has at least a 50% chance of occurring at the Wallarah 2, Drayton South and Moolarben mine sites. Incorporating local-scale hydrogeological information into the analysis for the Wallarah mine 2 (which was carried out for only this mine) substantially reduced the risk of drawdown exceeding 5 m due to additional coal resource development (see Section 3.3 and Section 3.7 in Herron et al., 2018c).
The year of maximum groundwater change varies throughout the Hunter subregion. It most likely occurs during the decades after mining activity ceases, and occurs later with increasing distance from mine tenements.
Around West Muswellbrook, Wambo and Wilpinjong mines, which were not represented in the groundwater model, the modelled drawdowns could be underpredicted.
Drawdown is a lowering of the groundwater level, caused, for example, by pumping. The groundwater model modelled drawdown under the coal resource development pathway and drawdown under the baseline (baseline drawdown). The difference in drawdown between the coal resource development pathway and baseline (referred to as additional drawdown) is due to additional coal resource development. In a confined aquifer, drawdown relates to a change in water pressure and does not necessarily translate to changes in depth to the watertable. The maximum drawdown over the course of the groundwater model simulation (from 2013 to 2102) is reported for each 1 km2 grid cell individually, and is expected to occur at different times across the area assessed. It is not expected that the year of maximum baseline drawdown coincides with the year of maximum additional drawdown. Therefore, simply adding the two figures will result in a drawdown amount that is not expected to eventuate. A mine pit exclusion zone was used to identify where the modelled estimates of drawdown were considered unreliable for use in the receptor impact modelling. It covers an area of 435 km2 within the zone of potential hydrological change in the Hunter subregion. Drawdown is not reported inside this area.Box 3 Calculating groundwater drawdown
Box 4 The zone of potential hydrological change
A zone of potential hydrological change (Figure 1) was defined to rule out potential impacts. It was derived by combining the groundwater zone of potential hydrological changewith the surface water zone of potential hydrological change (see Figure 15 and Figure 16 in Herron et al. (2018c)).
The groundwater zone is the area with at least a 5% chance of greater than 0.2 m drawdown (Box 3) due to additional coal resource development. This threshold is consistent with the most conservative minimal impact thresholds in NSW state regulations (which apply to Great Artesian Basin aquifers). Although this threshold does not apply in the Hunter subregion, it was applied here for consistency with other subregions in the Bioregional Assessment Programme. The groundwater zone was defined by changes in the regional watertable from which most ecological assets source water.
The surface water zone includes the streams with a change exceeding the defined threshold in at least one of nine surface water hydrological response variables(see Table 6 of Herron et al. (2018c)). The hydrological response variables represent different characteristics of the flow regime that could change due to coal resource development – for example, the annual flow volume or number of low-flow days. Changes in these variables could lead to impacts in ecosystems.
The zone of potential hydrological change defined where the impact and risk analysis focused (Herron et al., 2018c). Where the regional-scale modelling identified areas as potentially at risk of impacts, local-scale information is needed to better resolve the assessment of impact and risk to inform the management response.
Not all mines in the CRDP were included in the surface water and/or groundwater modelling (Figure 3). The potential hydrological changes from these developments are considered in the impact and risk analysis (Herron et al., 2018c). The inclusion of modelled hydrological changes from these developments would likely expand the zone of potential hydrological change in some areas and/or increase already modelled changes.
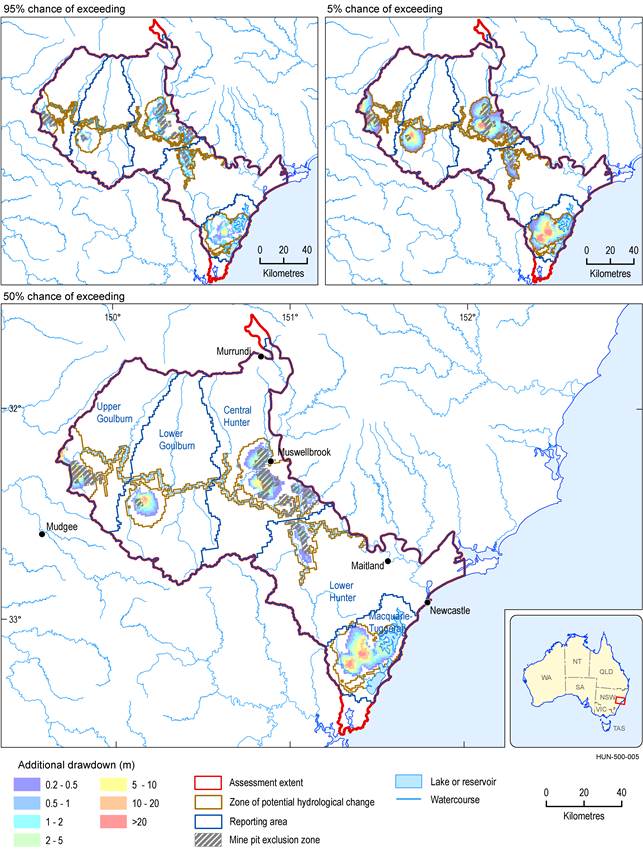
Additional drawdown is the maximum difference in drawdown between the coal resource development pathway and baseline, due to additional coal resource development (Box 3). Results are shown as percent chance of exceeding drawdown thresholds (Box 5). These appear in the impact and risk analysis (Herron et al., 2018c) as percentiles.
Data: Bioregional Assessment Programme (Dataset 1, Dataset 7, Dataset 8)
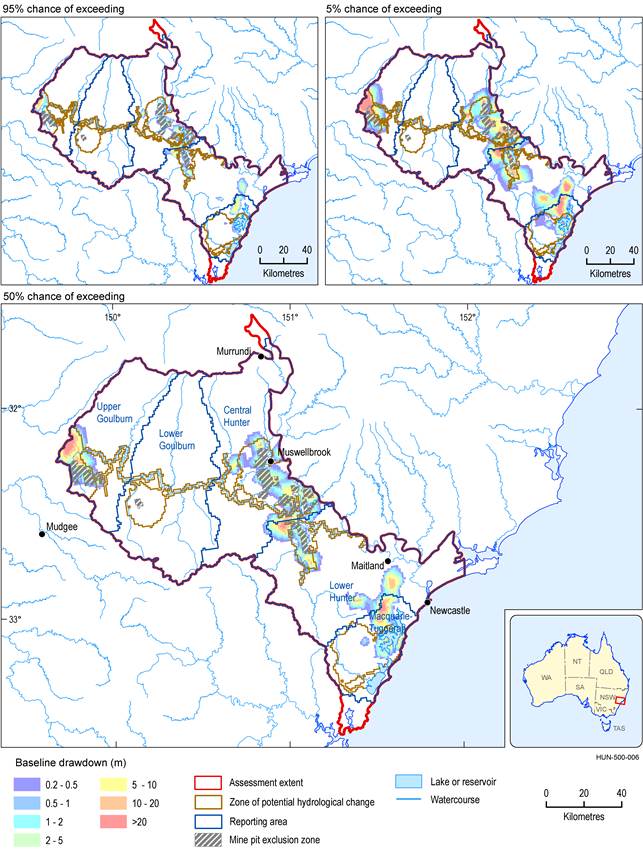
Baseline drawdown is the maximum difference in drawdown under the baseline relative to no coal resource development (Box 3). Results are shown as percent chance of exceeding drawdown thresholds (Box 5). These appear in the impact and risk analysis (Herron et al., 2018c) as percentiles.
Data: Bioregional Assessment Programme (Dataset 1, Dataset 7, Dataset 8)
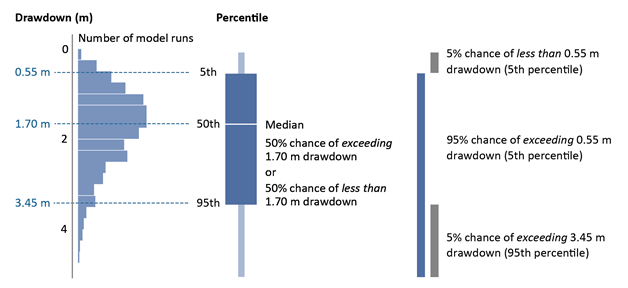
The chart on the left shows the distribution of results for drawdown in one assessment unit, obtained from an ensemble of thousands of model runs that use many sets of parameters. These generic results are for illustrative purposes only.
The models used in the assessment produced a large number of predictions of hydrological response variables rather than a single number. This results in a range or distribution of predictions, which are typically reported as probabilities – the percent chance of something occurring (Figure 10). This approach allows an assessment of the likelihood of exceeding a given magnitude of change, and underpins the assessment of risk. Hydrological models require information about physical properties, such as the thickness of geological layers and how porous aquifers are. It is unknown how these properties vary across the entire assessment extent (both at surface and at depth), and therefore the hydrological models were run thousands of times using different sets of values from credible ranges of those physical properties each time. The model runs were optimised to reproduce historical observations, such as groundwater level and changes in water movement and volume. A narrow range of predictions indicates more agreement between the model runs, which enables decision makers to anticipate potential impacts more precisely. A wider range indicates less agreement between the model runs and hence more uncertainty in the outcome. The distributions created from these model runs are expressed as probabilities that hydrological response variables (such as drawdown) exceed relevant thresholds, as there is no single ‘best’ estimate of change. In this assessment, the estimates of drawdown or streamflow change are shown as a 95%, 50% or 5% chance of exceeding thresholds. Throughout this synthesis, the term ‘very likely’ is used to describe where there is a greater than 95% chance that the model results exceed thresholds, and ‘very unlikely’ is used where there is a less than 5% chance. While models are based on the best available information, if the range of parameters used is not realistic, or if the modelled system does not reflect reality sufficiently, these modelled probabilities might vary from the changes that occur in reality. These regional-level models provide evidence to rule out potential cumulative impacts due to additional coal resource development in the future. Figure 11 Key areas for reporting probabilistic results The assessment extent was divided into smaller square assessment units and the probability distribution (Figure 10) was calculated for each. In this synthesis, results are reported with respect to the following key areas (Figure 11):Box 5 Understanding probabilities

Surface water
The potential changes due to additional coal resource development on surface water flow regimes were assessed using three hydrological response variables:
- maximum change in the annual number of low-flow days (i.e. days with flow less than the 10th percentile of simulated flows between 2013 and 2102 under the baseline) (Figure 12)
- maximum change in the annual number of high-flow days (i.e. days with flow greater than the 90th percentile of simulated flows between 2013 and 2102 under the baseline)
- maximum change in the annual flow over the 90-year simulation period (2013 to 2102).
Changes in other hydrological response variables can be viewed on the BA Explorer at www.bioregionalassessments.gov.au/explorer/HUN/hydrologicalchanges.
Results from regional-scale modelling indicate that large changes in flow regime are possible in Wyong River, Loders Creek, Saddlers Creek, Wollar Creek and a number of ephemeral creeks as a result of additional coal resource development.Key finding 4
In general, hydrological changes are greater in the small tributaries of the Hunter River (shown in Figure 12) than along the river itself. The largest hydrological changes occur in Loders Creek and a nearby unnamed creek, which drain the Bulga and Mount Thorley–Warkworth mines and enter the Hunter River just upstream of Singleton, as well as in Dry Creek and an unnamed creek near Muswellbrook, which drain the Bengalla and Mount Pleasant mines. These small streams are very likely to experience large changes in flow regime due to additional coal resource development – such as increases in low-flow days of at least 20 days per year, decreases in high-flow days of at least 10 days per year, and at least 20% (50% in some cases) decreases in mean annual flow volume.
Dry Creek and the two unnamed creeks are small, hence potential hydrological changes are mostly restricted to the creeks themselves. The Hunter Regulated River, into which they flow, is not very sensitive to changes in inflows from these creeks. Changes in flow in Wollar Creek, Saddlers Creek and Loders Creek have a hydrological effect on the Goulburn and Hunter rivers into which they flow.
The larger Wyong River is a perennial stream, and model estimates vary from a high probability (95% chance) of small changes (e.g. increases in the number of low-flow days per year between 3 and 20 days) to a small probability (5% chance) of large changes (e.g. more than 200 additional low-flow days) in flow regime due to additional coal resource development. The larger changes are outside the range of variability seen under the baseline, which is more likely to move the system outside the range of conditions previously encountered.
Local-scale information can be used to refine the regional-scale estimates in areas identified as at risk. An example of the use of local hydrogeological information to constrain regional model estimates in the Wyong river basin is provided in Section 3.3.3.1 of Herron et al. (2018c) and is summarised here.
Hydrogeological information from the environmental impact statement for the proposed Wallarah 2 development (Mackie Environmental Research, 2013) was used to identify the subset of groundwater modelling simulations with parameter values consistent with local hydraulic measurements. Measured median hydraulic conductivities in this area are about two orders of magnitude less than the median of the parameter values used for all of the simulations. The drawdown and changes in surface water were recalculated for this subset of simulations. The small chance of 200 additional low-flow days per year based on the regional analysis becomes a small chance of at least 7 additional low-flow days when the baseflows from the locally relevant subset of groundwater modelling simulations are fed into the surface water model.
The additional coal resource developments at Mandalong Southern Extension, West Muswellbrook, Wambo and Wilpinjong mines were not represented in the surface water and/or groundwater models. Therefore, surface water hydrological changes cannot be ruled out in the following locations:
- Dora, Mannering, Moran, Stockton, Wallarah and Wyee creeks around the Mandalong underground mine
- Wybong, Dartbrook and other nearby creeks around the proposed West Muswellbrook open-cut mines
- the Goulburn River and Wollar Creek near Wilpinjong open-cut mine expansions
- possibly around proposed expansions of the Wambo underground mine.
Low-flow days
The impact due to additional coal resource development is generally greater on low flows than on high flows. There are streams near all the additional coal resource developments in the Hunter subregion that are modelled to have a 50% chance of at least 20 additional low-flow days per year (i.e. below the 10th percentile simulated flow under the baseline between 2013 and 2102) due to the additional coal resource development (Figure 12). Increases of more than 80 low-flow days per year are very likely in the unnamed creek draining the Mount Pleasant and Bengalla developments. There is a 5% chance that the increase in low-flow days in the two unnamed creeks, Loders Creek, Saddlers Creek, Dry Creek and the Wyong River could exceed 200 days per year due to additional coal resource development. These larger changes are outside the range of variability experienced under the baseline, which is more likely to move the system outside the range of conditions previously encountered (Figure 23 in Herron et al. (2018c)). The assessment found that the combination of runoff interception and changes in baseflow caused by groundwater drawdown contributed to increases in low-flow days.
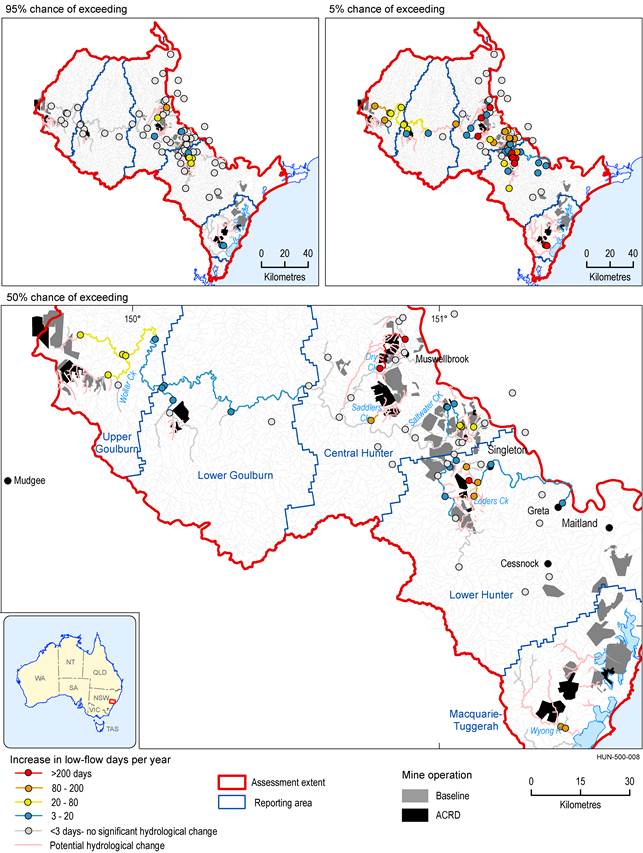
Mines in the coal resource development pathway (CRDP) include baseline and additional coal resource developments (ACRD). The difference in low-flow days between the CRDP and baseline is due to ACRD. Results are shown as percent chance of exceeding given values of change (Box 5). These appear in Herron et al. (2018c) as percentiles.
Data: Bioregional Assessment Programme (Dataset 12)
High-flow days
Reductions in high-flow days of at least 3 days per year are very likely along lower Wollar Creek, which drains the Moolarben and Wilpinjong mine developments, and in Dry Creek, Loders Creek, Saddlers Creek and Wyong River. There is at least a 50% chance that the Wyong River experiences reductions in high-flow days of at least 3 days per year, but is very unlikely to experience reductions greater than 20 days per year. It is very unlikely that the Hunter Regulated River and most of the Goulburn River experience reductions of more than 10 high-flow days per year. Changes in high-flow characteristics tend to be dominated by interception of runoff.
Annual flow
Results for the Hunter Regulated River show that decreases in mean annual flow of between 1% and 2% are very likely, and decreases of more than about 2% upstream of the junction with Loders Creek, or 3% to 4% downstream of this point to Greta, are very unlikely.
Decreases in mean annual flow of at least 5% are very likely in the smaller Dry Creek, Wollar Creek, Saddlers Creek, Loders Creek and the two unnamed creeks draining the Mount Pleasant and Mount Thorley–Warkworth mine sites.
There is at least a 50% chance that these changes are comparable to the interannual variability of annual flow under the baseline in Dry Creek, Loders Creek and one of the unnamed creeks. Such a change would move the system outside the range of conditions previously encountered. More detail is available in Figure 27 of Herron et al. (2018c).
Water quality
Water quality was not modelled in this assessment, but the implications for stream salinity in the Hunter subregion were considered in light of the modelled hydrological changes due to additional coal resource development, salinity hazard mapping and existing regulatory controls (see Section 3.3.5 of Herron et al. (2018c)). Some of the streams identified as at risk of potentially large hydrological changes, such as Loders Creek and Saddlers Creek, are naturally highly saline, and this would be expected to influence the management response to the predicted hydrological changes.
Salinity of the Hunter Regulated River is managed through the Hunter River Salinity Trading Scheme. Under the scheme, annual discharges by mines to the river are managed to maintain stream salinity at an acceptable level for other users. Modelling results suggest there will be minimal impact on the number of high-flow days when discharge is permitted under the scheme.
Changes in stream salinity cannot be ruled out. Groundwater is typically more saline than surface runoff. This suggests that reductions in baseflow are more likely to lead to decreases in stream salinity, while reductions in catchment runoff could lead to increases in salinity. The actual effects depend very much on local conditions and relative changes in surface water and groundwater components of the streamflow.
Explore the hydrological changes in more detail on the BA Explorer, available at www.bioregionalassessments.gov.au/explorer/HUN/hydrologicalchanges Observations analysis, statistical analysis and interpolation, product 2.1-2.2 (Herron et al., 2018b) Water balance assessment, product 2.5 (Herron et al., 2018a) Surface water numerical modelling, product 2.6.1 (Zhang et al., 2018) Groundwater numerical modelling, product 2.6.2 (Herron et al., 2018d) Impact and risk analysis, product 3-4 (Herron et al., 2018c) Surface water modelling, submethodology M06 (Viney, 2016) Groundwater modelling, submethodology M07 (Crosbie et al., 2016) Impacts and risks, submethodology M10 (Henderson et al., 2018)FIND MORE INFORMATION
