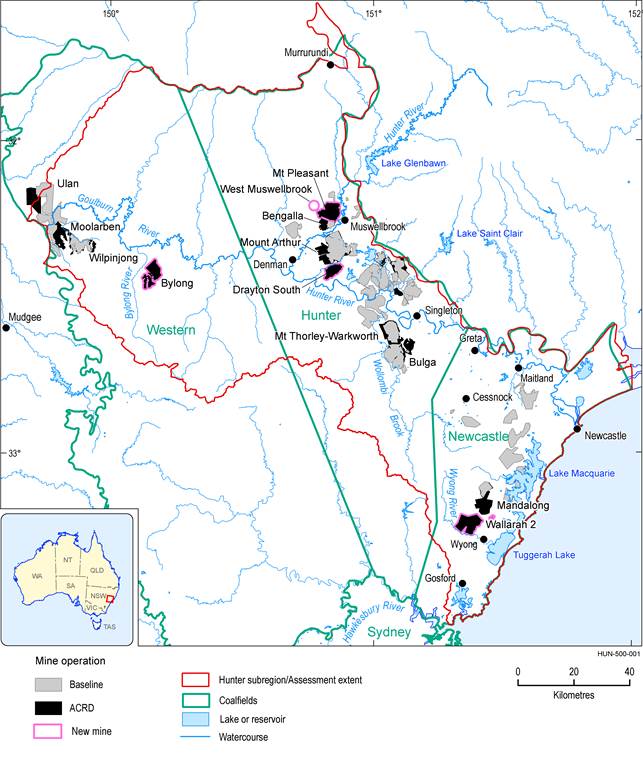
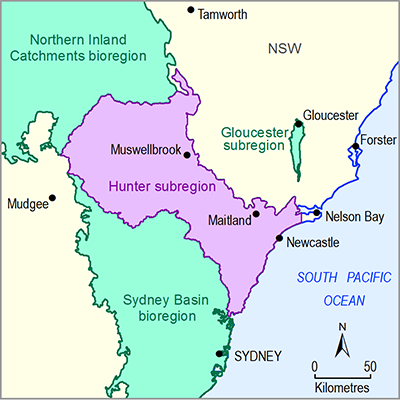
In the Hunter subregion (Figure 2), the assessment extent (the total area investigated) is the same as the subregion extent, which covers 17,045 km2. It includes a large part of the Hunter river basin and all of the Macquarie-Tuggerah lakes basin in NSW. Major population centres include Newcastle and Gosford-Wyong along the coast, with smaller urban areas inland, including Maitland, Cessnock, Singleton and Muswellbrook.
The dominant land use along the subregion coast is urban, while grazing, production forestry and nature conservation dominate the hinterland areas of Gosford and Wyong. Mining, irrigated agriculture, viticulture and horse breeding are economically important land uses in the Hunter river basin. Water users include the urban, power generation and coal mining sectors; agriculture; and the environment. Environmental water and access to water for consumptive use are managed through water sharing plans that specify extraction limits and water access rights to surface water and groundwater sources.
The Hunter subregion is of great ecological significance because it corresponds to a break in the Great Dividing Range that provides a link between coastal and inland NSW, and includes an overlap between tropical and temperate climate zones. It includes the Ramsar-listed Kooragang Nature Reserve and Hunter Wetland Centre Australia, 17 important wetlands, 6 threatened ecological communities, 7 Important Bird Areas, and 105 nationally listed flora and fauna species.
This assessment focused on water-dependent ecosystems and assets in the subregion that are potentially impacted by changes in groundwater or surface water regime due to coal resource development.
Ecosystems in the assessment extent were categorised through a landscape classification (Box 6), based on the subregion’s geology, geomorphology (physical features), hydrogeology (the way water moves through porous rocks), land use and ecology. See ‘What are the potential impacts of additional coal resource development on ecosystems?’ for more information.
The community nominated assets that they consider important due to their ecological, economic or sociocultural values (Bioregional Assessment Programme, 2017; Macfarlane et al., 2016). These include ecosystems such as stream vegetation that provides habitat for frogs, groundwater used for agriculture, and sites of cultural significance. See ‘What are the potential impacts of additional coal resource development on water-dependent assets?’ for more information.
In the Hunter subregion, the assessment extent is the same as the subregion extent. Mines in the coal resource development pathway (CRDP) include baseline and additional coal resource developments (ACRD). Only mines referred to in the text are labelled.
Data: Bioregional Assessment Programme (Dataset 2, (Dataset 3, (Dataset 4)
Coal resource development
The coal resource development pathway (Box 1) was deemed the most likely future for the subregion as of September 2015. It includes 42 coal mines that were in commercial production in December 2012, and 22 additional coal resource developments: 4 new open-cut mines, 2 new underground mines and 16 expansions to existing operations.Key finding 1:
Coal mining has been occurring in the Hunter subregion since around 1800. In December 2012, there were 22 open-cut mines and 20 underground mines operating.
When the coal resource development pathway was finalised in September 2015, the additional coal resource developments included 22 proposals for new or expanded operations; ten other potential coal resource developments were considered too exploratory or unlikely to proceed and were not included in the additional coal resource development. There is no CSG production in the Hunter subregion, nor any proposals for CSG development in the future, although a couple of gas companies hold petroleum exploration licences in the subregion.
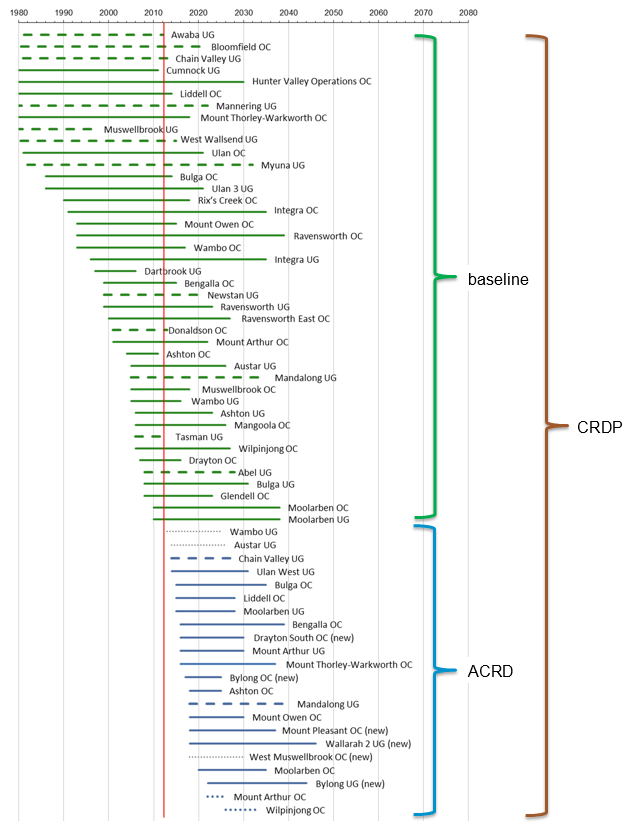
This assessment focused on the potential cumulative impact between 2013 and 2102 of additional coal resource developments. The timeline of construction and production for each coal resource development is shown in Figure 3. This figure also shows which developments were included in the quantitative modelling for the subregion. Some additional coal resource developments were not modelled at all (Austar underground, West Muswellbrook and Wambo), or were modelled using just the groundwater model (Chain Valley underground and Mandalong) or just the surface water model (Mount Arthur open-cut, Wilpinjong). More details can be found in the impact and risk analysis (Section 3.6 of Herron et al. (2018c)). Reasons for not modelling mines included insufficient data, scale of the proposed modifications, or mining under coastal lakes. Potential impacts from those non-modelled mines where hydrological changes are possible are discussed in Section 3.6 of Herron et al. (2018c).
The subregion straddles three of the five coalfields that make up the geological Sydney Basin (Figure 2). The Hunter and Newcastle coalfields contain the Greta Coal Measures, the Wittingham (Hunter Coalfield) and Tomago (Newcastle Coalfield) Coal Measures, and the Newcastle Coal Measures. The coal of economic interest in the Western Coalfield is in the Illawarra Coal Measures. Operations in the Newcastle Coalfield are predominantly underground, whereas the Hunter and Western coalfields contain a greater mix of underground and open-cut operations.
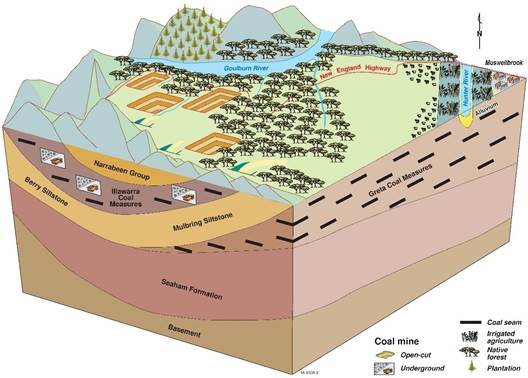
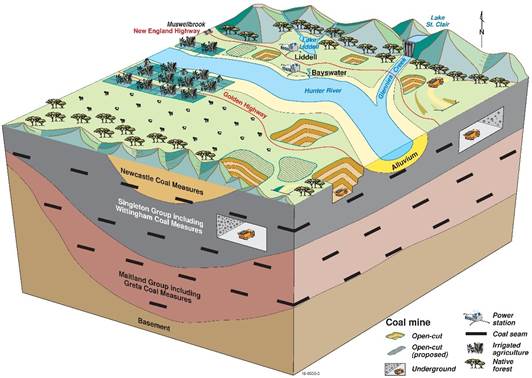
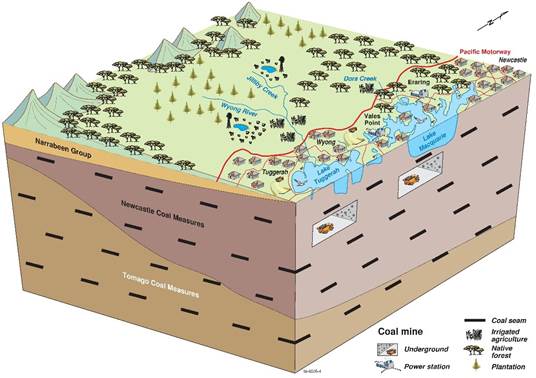
Three regional-scale block diagrams illustrate coal resource development in the three major coalfields of the Hunter subregion: Western Coalfield (Figure 4), Hunter Coalfield (Figure 5) and Newcastle Coalfield (Figure 6).
More information about the coal and CSG resources, mines and proposed developments can be found in the coal and CSG resource assessment (Hodgkinson et al., 2015).
Figure 3 Timeline for coal resource developments in the coal resource development pathway
green = baseline as at December 2012, blue = additional coal resource development as of September 2015, red line = December 2012, light grey = not modelled, blue or green dashes = groundwater model only, blue dots = surface water model only, OC = open-cut, UG = underground
The dates reflect the expected period of coal extraction and may not coincide precisely with the dates used for mine pumping in the modelling. Mines in the coal resource development pathway include baseline and additional coal resource developments (ACRD).
Data: Bioregional Assessment Programme (Dataset 5)
This section through the Goulburn river basin, just north of the Goulburn River, represents the area from Mudgee to Muswellbrook. The Berry Siltstone (Mulbring Siltstone in the Hunter Coalfield) is near the surface and provides an aquitard that moves water laterally and feeds surface springs and streams. Coal seams of the Illawarra Coal Measures are also near the surface in the west and subject to both open-cut and underground coal mine operations. In the east, the Greta Coal Measures become thicker and nearer to the land surface.
This block diagram is not to scale, but is representative based on the geological model.
This area contains a high density of coal mine operations along the Hunter River, most of which target the Wittingham Coal Measures. The surface Hawkesbury Sandstone layers are absent when mapped at this scale, and the Wittingham Coal Measures are the thickest individual unit underlying the area, most of which is close to the surface.
This block diagram is not to scale, but is representative based on the geological model.
This area contains predominantly underground mines near the coastal lake systems south of Newcastle. The Hawkesbury Sandstone (not shown) and Narrabeen Group form the uplands between river floodplains, with the Newcastle Coal Measures thickening towards the coast and the deeper Tomago Coal Measures thickening away from the coast.
This block diagram is not to scale, but is representative based on the geological model.
Context statement, product 1.1 (McVicar et al., 2015) Coal and coal seam gas resource assessment, product 1.2 (Hodgkinson et al., 2015) Description of the water-dependent asset register, product 1.3 (Macfarlane et al., 2016) Water-dependent asset register (Bioregional Assessment Programme, 2017) Conceptual modelling, product 2.3 (Dawes et al., 2018) Compiling water-dependent assets, submethodology M02 (Mount et al., 2015) Developing a coal resource development pathway, submethodology M04 (Lewis, 2014)FIND MORE INFORMATION
Product Finalisation date
- Executive summary
- Explore this assessment
- About the subregion
- How could coal resource development result in hydrological changes?
- What are the potential hydrological changes?
- What are the potential impacts of additional coal resource development on ecosystems?
- What are the potential impacts of additional coal resource development on water-dependent assets?
- How to use this assessment
- Building on this assessment
- References and further reading
- Datasets
- Contributors to the Technical Programme
- Acknowledgements
- Citation

