- Home
- Assessments
- Bioregional Assessment Program
- Maranoa-Balonne-Condamine subregion
- 5 Outcome synthesis for the Maranoa-Balonne-Condamine subregion
- What are the potential hydrological changes?
In the Maranoa-Balonne-Condamine subregion, modelled hydrological changes are limited to groundwater because the groundwater model’s (Box 3) limited capabilities with respect to simulating surface water – groundwater interactions meant that surface water modelling was not carried out for this assessment.
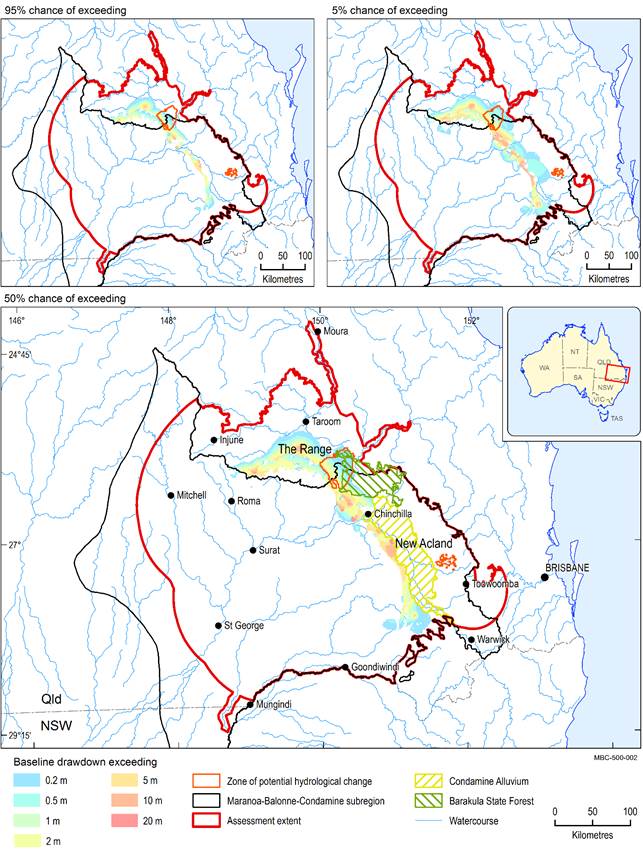
Figure 7 shows that baseline drawdown in the regional watertable is typically less than 20 m and occurs in the east and north of the subregion. Median baseline drawdown in the regional watertable is less than 3 m in the vicinity of New Acland Coal Mine and less than 8 m in the vicinity of The Range coal mine (Table 1).
Groundwater modelling (Box 3) showed that additional coal resource development potentially causes hydrological changes in the regional watertable within an area of 1631 km2 (Figure 8 and Figure 9). This means the regional watertable is predicted to have a greater than 5% chance of exceeding 0.2 m additional drawdown (Box 4) over 1631 km2. Subsequently in this synthesis the extent within the zone of potential hydrological change is reported as 1544 km2, excluding the 87 km2 within the modelled open-cut mine pits that are not included in the analysis.
Within this zone of potential hydrological change (Box 5), these additional coal resource developments might affect water-dependent landscapes and assets. Outside the zone, the hydrological changes are very unlikely (less than 5% chance, see Box 6) to have an appreciable impact on water-dependent landscapes or assets.
It is very unlikely that drawdown due to additional coal resource development exceeds 0.2 m in the regional watertable, except within 15 km of New Acland Coal Mine Stage 3 and within 25 km of The Range coal mine. Drawdown in the regional watertable due to additional coal resource development has at least a 5% chance of exceeding 0.2 m in an area of 1544 km2 (1.2% of the total assessment extent of 129,956 km2), including 1095 km of streams (1.8% of the 60,958 km of streams in the total assessment extent). Drawdown in the regional watertable under the baseline has at least a 5% chance of exceeding 0.2 m in an area of 17,132 km2. This area is 11 times larger than the equivalent area due to additional coal resource development (1544 km2).Key finding 2
Key finding 3
Most ecological assets source water from the regional watertable. Results are also reported in Table 1 and Figure 11 for the Walloon Coal Measures and Hutton/Marburg Sandstone to indicate potential impacts on groundwater bores that access these deeper layers.
In the Maranoa-Balonne-Condamine subregion, maximum baseline drawdown in the Walloon Coal Measures is predicted between the towns of Chinchilla and Roma (Janardhanan et al., 2016). This geological layer is 200 to 1000 m below the surface in this area and is the target for CSG development. In the vicinity of the two additional coal resource developments (Table 1 and Figure 11), an area of 2545 km2 has at least a 5% chance of exceeding 0.2 m additional drawdown in the Walloon Coal Measures. An area of 2111 km2 has this level of additional drawdown in the Hutton/Marburg Sandstone.
Table 1 Areas and range of median drawdown values under the baseline and due to additional coal resource development in the vicinity of New Acland Coal Mine Stage 3 and of The Range coal mine
The regional watertable in the zone includes the alluvium, Main Range Volcanics and outcropping areas of the Walloon Coal Measures and Hutton/Marburg Sandstone geological layers (Figure 3).
Median is a 50% chance (Box 6).
Zone area is the area outside of modelled mine pits with at least a 5% chance of exceeding 0.2 m drawdown due to additional coal resource development in the relevant aquifer.
‘Baseline’ is ‘baseline coal resource development’ and ‘additional’ is ‘additional coal resource development’.
na = not applicable
Data: Bioregional Assessment Programme (Dataset 7, Dataset 8, Dataset 9)
This assessment adopted the Office of Groundwater Impact Assessment’s (OGIA) 2012 model and the CSG development profile from OGIA’s Annual report 2014 for the Surat underground water impact report (OGIA, 2014). OGIA’s most recent model from 2016 (OGIA, 2016) was not available for this assessment. OGIA also provided data relating to coal mines and their development footprints, which have been used to represent open-cut coal mines in the groundwater model at a regional scale using 2.25 km2 grid cells. The area within modelled pits is not reported in this synthesis. OGIA is an independent entity established to assess and manage cumulative groundwater impacts from resource activities in areas of concentrated CSG development, known as cumulative management areas (CMAs). Originally established to assess groundwater impacts from petroleum and gas resource developments, including both conventional hydrocarbon resources and unconventional resources such as CSG, OGIA has undertaken cumulative assessments to capture the CSG footprints for the Surat and southern Bowen basins in 2012 and 2016. These are reported through underground water impact reports (UWIRs). The assessments include predicted impacts on water supply bores and springs. OGIA developed regional groundwater flow models to underpin cumulative assessments for the two UWIRs: one in 2012 (QWC, 2012) and a revised one in 2016 (OGIA, 2016; not available for this assessment). The models were built for regional groundwater impact assessment in aquifers overlying and underlying the CSG target formations. Impacts on baseline drawdown in the Condamine Alluvium are estimated using the integrated Condamine and regional models (QWC, 2012). Additional drawdown is very unlikely to exceed 0.2 m in the Condamine Alluvium (Janardhanan et al., 2017). Drawdown is a lowering of the groundwater level, caused, for example, by pumping. The groundwater model Box 3) predicts drawdown under the CRDP and drawdown under the baseline (baseline drawdown). The difference in drawdown between the CRDP and baseline futures (referred to as additional drawdown) is due to additional coal resource development. In a confined aquifer, drawdown relates to a change in water pressure and does not necessarily translate to changes in depth to the watertable. The maximum drawdown over the course of the groundwater model simulation (from 2013 to 2102) is reported for each 2.25 km2 grid cell individually, and is expected to occur at different times across the area assessed. It is not expected that the year of maximum baseline drawdown coincides with the year of maximum additional drawdown. Therefore, simply adding the two figures will result in a drawdown that is not expected to eventuate. The predicted drawdown (Box 4) was used to define a zone to ‘rule out’ potential impacts. The zone is the area with at least a 5% chance of greater than 0.2 m drawdown due to additional coal resource development (Figure 8 and Figure 9). This threshold is consistent with the most conservative minimal impact thresholds in NSW and Queensland state regulations (Box 9). Because surface water modelling was not undertaken for this subregion, only groundwater hydrological changes were used to define the zone. The zone was defined by changes in the regional watertable from which most ecological assets source water. Water-dependent landscapes and ecological assets outside of this zone are very unlikely to experience any hydrological change due to additional coal resource development. Within the zone, potential impacts may need to be considered further in the impact and risk analysis and smaller-scale analyses that take into account local conditions. The zone of potential hydrological change was also defined for deeper geological layers (Figure 11) so that potential impacts can be identified for springs and groundwater bores that access these layers. Box 3 Understanding the groundwater model
Box 4 Calculating groundwater drawdown
Box 5 The zone of potential hydrological change
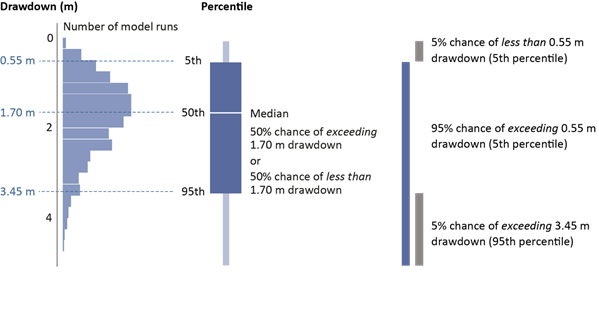
Figure 5 Illustrative example of probabilistic drawdown results using percentiles and percent chance
The chart on the left shows the distribution of results for drawdown, obtained from an ensemble of thousands of model runs that use many sets of parameters. These generic results are for illustrative purposes only.
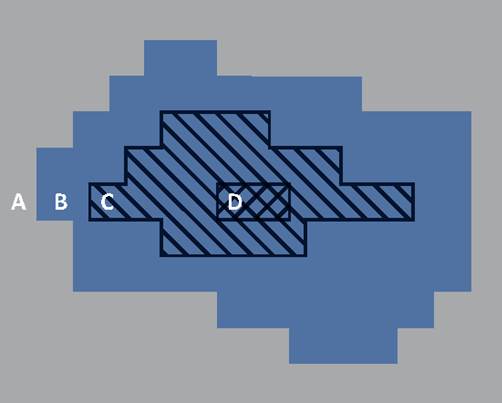
The models used in the assessment produced a large number of predictions of groundwater drawdown rather than a single number. This results in a range or distribution of predictions, which are typically reported as probabilities – the percent chance of something occurring (Figure 5). This approach allows an assessment of the likelihood of exceeding a given magnitude of change, and underpins the assessment of risk. Hydrological models require information about physical properties such as the thickness of geological layers and how porous aquifers are. It is unknown how these properties vary across the entire assessment extent (both at surface and at depth), and therefore the hydrological models were run thousands of times using different sets of values from credible ranges of those physical properties each time. The model runs were optimised to reproduce historical observations, such as groundwater level and changes in water movement and volume. A narrow range of predictions indicates more agreement between the model runs, which enables decision makers to anticipate potential impacts more precisely. A wider range indicates less agreement between the model runs and hence more uncertainty in the outcome. The distributions created from these model runs are expressed as probabilities that hydrological response variables (such as drawdown) exceed relevant thresholds, as there is no single ‘best’ estimate of change. In this assessment, the estimates of drawdown are shown as a 95%, 50% or 5% chance of exceeding thresholds. Throughout this synthesis, the term ‘very likely’ is used to describe where there is a greater than 95% chance that the model results exceed thresholds, and ‘very unlikely’ is used where there is a less than 5% chance. While models are based on the best available information, if the range of parameters used is not realistic, or if the modelled system does not reflect reality sufficiently, these modelled probabilities might vary from the actual changes that occur in reality. These regional-level models provide evidence to ‘rule out’ potential cumulative impacts due to additional coal resource development in the future. Figure 6 Key areas for reporting probabilistic results The assessment extent was divided into smaller square assessment units and the probability distribution (Figure 5) was calculated for each. In this synthesis, results are reported with respect to the following key areas (Figure 6):Box 6 Understanding probabilities
Baseline drawdown is the maximum difference in drawdown under the baseline relative to no coal resource development (Box 4). Results are shown as percent chance of exceeding drawdown thresholds (Box 6). These appear in product 3-4 (impact and risk analysis) (Holland et al., 2017) as percentiles. The location of the Barakula State Forest near Miles is shown for reference.
Data: Bioregional Assessment Programme (Dataset 3, Dataset 7, Dataset 8, Dataset 10, Dataset 11, Dataset 13); Queensland Office of Groundwater Impact Assessment (Dataset 5, Dataset 12)
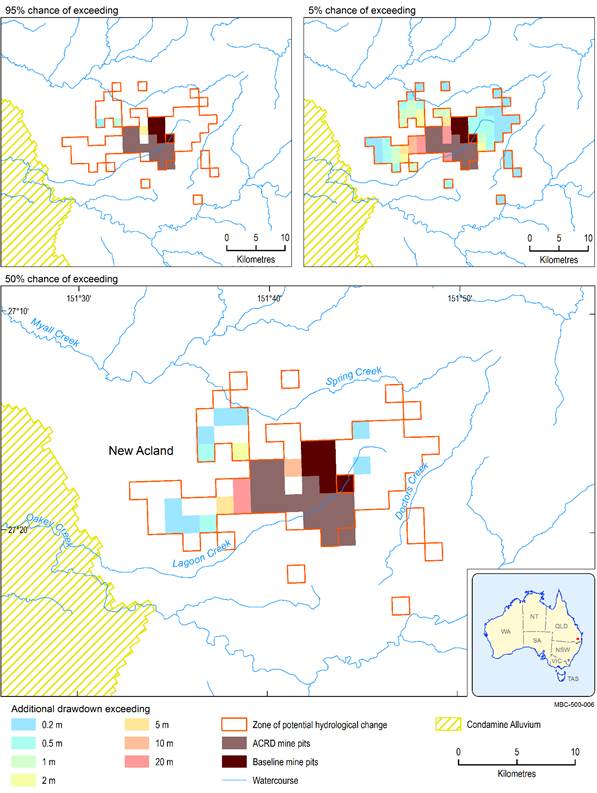
Near New Acland Coal Mine Stage 3 (Figure 8), additional drawdown in the regional watertable in excess of 0.2 m is very likely over an area of 7 km2 (containing 4 km of streams) and very unlikely to extend beyond an area of 134 km2 (containing 55 km of streams). Key finding 4:
The range of model predictions in the vicinity of New Acland Coal Mine Stage 3 (Figure 8) indicates that additional drawdown in the regional watertable in excess of 5 m is very likely to be experienced in an area of 2 km2 (which includes 1 km of streams) and very unlikely to extend beyond 20 km2 (which includes 9 km of streams).
Extraction of groundwater to enable dewatering of open-cut mine pits at New Acland Coal Mine has the greatest cumulative impact on water levels in the Walloon Coal Measures. Near the mine, median drawdown in this layer is up to 3.6 m under the baseline and up to 24.9 m due to additional coal resource development. Further west, near the eastern edge of the Condamine Alluvium, median baseline drawdown due to CSG development is less than 2 m in the Walloon Coal Measures. However, this does not overlap with the drawdown near the mine (Figure 11).
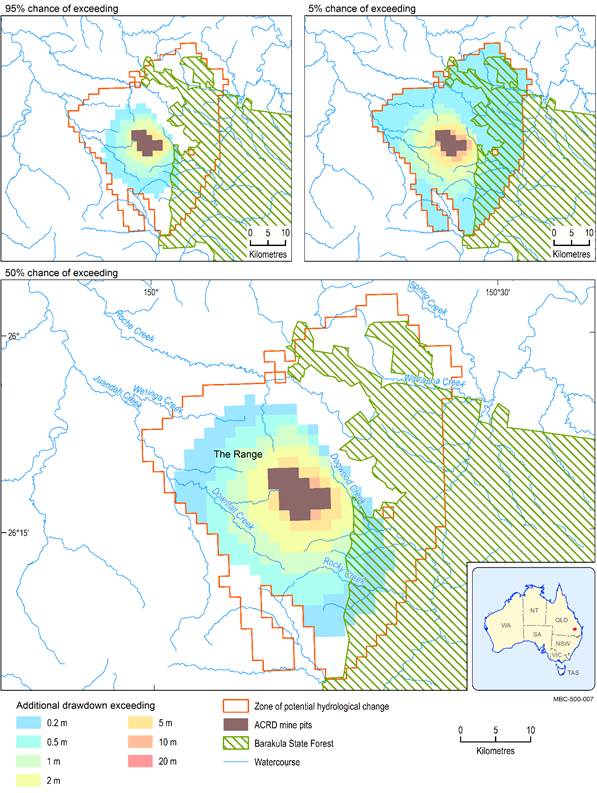
Near The Range coal mine (Figure 9), additional drawdown in the regional watertable in excess of 0.2 m is very likely over an area of 377 km2 (containing 231 km of streams) and very unlikely to extend beyond an area of 1409 km2 (containing 1040 km of streams).Key finding 5:
The range of model predictions in the vicinity of The Range coal mine (Figure 9) indicates that additional drawdown in the regional watertable in excess of 5 m is not very likely in any of the assessment units and very unlikely to extend beyond 90 km2 (which includes 31 km of streams).
Median baseline drawdown is up to 8.3 m in the regional watertable and up to 82 m in the Walloon Coal Measures, the target of CSG production, which is up to 170 m thick in this area.
Median additional drawdown is less than 10.2 m in the Walloon Coal Measures, which is the regional watertable in the vicinity of The Range coal mine.
Additional drawdown is the maximum difference in drawdown between the coal resource development pathway (CRDP) and baseline, due to additional coal resource development (Box 4). Results are shown as a percent chance of exceeding drawdown thresholds (Box 6). These appear in product 3-4 (impact and risk analysis) (Holland et al., 2017) as percentiles. The mine pits in the CRDP are the sum of those in the baseline and the additional coal resource development (ACRD).
Data: Bioregional Assessment Programme (Dataset 7, Dataset 8, Dataset 11, Dataset 13); Queensland Office of Groundwater Impact Assessment (Dataset 5)
Additional drawdown is the maximum difference in drawdown between the coal resource development pathway (CRDP) and baseline, due to additional coal resource development (Box 4). Results are shown as a percent chance of exceeding drawdown thresholds (Box 6). These appear in product 3-4 (impact and risk analysis) (Holland et al., 2017) as percentiles. The location of the Barakula State Forest near Miles is shown for reference.
Data: Bioregional Assessment Programme (Dataset 7, Dataset 8, Dataset 10, Dataset 11, Dataset 13); Queensland Office of Groundwater Impact Assessment (Dataset 5)
Explore the hydrological changes in more detail at www.bioregionalassessments.gov.au/explorer/MBC/hydrologicalchanges Groundwater numerical modelling, product 2.6.2 (Janardhanan et al., 2016) Impact and risk analysis, product 3-4 (Holland et al., 2017) Groundwater modelling, submethodology M07 (Crosbie et al., 2016) Analysing impacts and risks, submethodology M10 (Henderson et al., 2017) Regional watertable (Dataset 3) Groundwater model uncertainty analysis (Dataset 8) Summary of groundwater drawdown by assessment unit (Dataset 11) FIND MORE INFORMATION
Product Finalisation date
- Explore this assessment
- About the subregion
- How could coal resource development result in hydrological changes?
- What are the potential hydrological changes?
- What are the potential impacts of additional coal resource development on the landscape?
- What are the potential impacts of additional coal resource development on water-dependent assets?
- How to use this assessment
- Building on this assessment
- References and further reading
- Datasets
- Contributors to the Technical Programme
- Acknowledgements
- Citation

