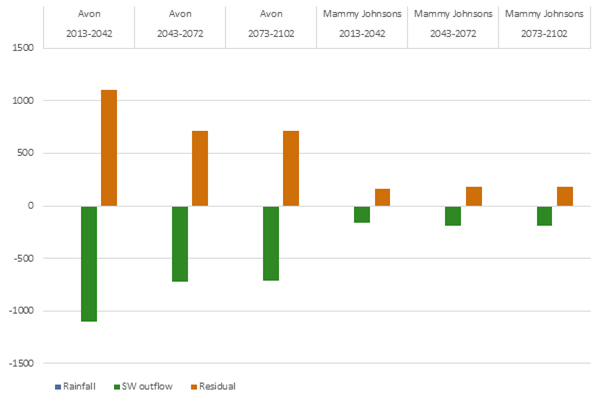
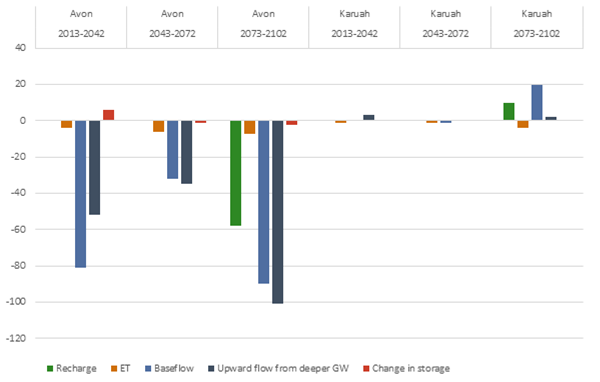
Surface water balances at node 6 (Figure 3(b) of Section 2.5.1) on the Avon River are provided in Table 3 for 2013 to 2042, 2043 to 2072 and 2073 to 2102. Groundwater balances for the alluvial groundwater in the Avon River (Figure 3 of Section 2.5.1) are provided in Table 4 for 2013 to 2042, 2043 to 2072 and 2073 to 2102. The median changes in the water balance terms attributable to the additional coal resource development are illustrated in Figure 5 for surface water and Figure 6 for groundwater. The water balances are summarised separately because, as stated in Section 2.5.1, they apply to different areas. The surface water balance applies to an area of 256.1 km2, whereas the alluvial groundwater model extent is 36.1 km2. Rainfall inputs over the three reporting periods reflect changes due to a varying climate signal.
Licensed extractions for non-mining uses are not reported because they were not represented in the model (see Section 2.5.1.1). The impact of licensed extractions of groundwater for coal seam gas (CSG) and dewatering of coal mines are reflected in the upward flow from deeper groundwater water balance term.
Within each table, the impact of the additional coal resource development (ACRD), calculated as the difference between the baseline coal resource development (baseline) and the coal resource development pathway (CRDP), reflects the impacts of mining and CSG development only, as the climate signal is identical in both modelling runs.
The differences between corresponding values over the three reporting periods encompass both the effects of climate and the coal resource development.
The effects of the assumed climate change (see Section 2.5.1.1; also Section 2.6.1.3.3 in companion product 2.6.1 for the Gloucester subregion (Zhang et al., 2018)) on the water balance in the Avon River are very small. There is a decreasing trend in rainfall which flows through to a decreasing trend in the surface water outflow and groundwater recharge. However, the magnitude of the change is very small, with less than 1% decrease in rainfall and surface water outflow and slightly more than 1% decrease in groundwater recharge when the 2073 to 2102 period is compared to the 2013 to 2042 period for the baseline.
The difference in the surface water balances for the baseline and the CRDP is reported in terms of changes to surface water outflows and a compensatory residual term which reflects the net change due to changes in evapotranspiration, leakage and storage. Median surface water outflows are reduced on average by 1105 ML/year in the 2013 to 2042 period, but recover somewhat in the subsequent two 30-year periods (Table 3) to mean annual reductions of 717 and 712 ML/year. Most of the difference can be attributed to the retention of surface runoff on the mine site rather than to groundwater extraction because the changes in baseflow (discharge to stream) for all three periods (Table 4) are approximately an order of magnitude lower than the changes in surface water outflow (Table 3). The maximum mine footprint areas (i.e. areas where surface drainage is disrupted by mining activities) for the open-cut Stratford and Rocky Hill coal mines occur within the period having the largest surface outflow reductions on average. This is consistent with the conceptualisation of changes to surface runoff being instantaneous, rather than lagged as they are for groundwater responses. The surface water model assumes no disruption to surface drainage from the AGL CSG development.
Surface runoff does not return to pre-mining levels during the simulated period because the area of ongoing surface water drainage disruption following rehabilitation of the mine site is around 2 km2 larger under the CRDP than under the baseline (see Figure 7 in companion product 2.6.1 for the Gloucester subregion (Zhang et al., 2018)) and there is a small but sustained reduction in baseflow. The decrease in surface water outflow is reflected in an increase in the residual water balance term. Most of the residual water is lost as evapotranspiration, although leakage of water from open-cut pits and mine water storages may account for a small component and there would also be a small adjustment in catchment storage. Changes to the individual terms have not been quantified in the modelling. The decrease in surface water outflow under the CRDP is less than 2% of the baseline surface water outflow and within the uncertainty of the predicted surface water outflow. Changes in other hydrologic response variables can be more significant than these changes in mean annual flows (see Section 2.6.1.6 of companion product 2.6.1 (Zhang et al., 2018)).
The conceptual model of groundwater movement adopted for modelling the Avon River groundwater systems is that deeper groundwater flows upward into the alluvium, mixes with locally recharged water from rainfall and then discharges into streams as baseflow. Effects of coal mine dewatering and depressurisation due to CSG extraction will be propagated into the alluvial aquifer through reduced upward flow of deeper groundwater. Whether or not the changes in upward flux will be noticeable in the alluvial aquifer depends on the magnitude of the flux and the degree to which the water balance in the alluvial aquifer is driven by local, shallow processes or by deeper groundwater fluxes. The wide range between the 10th and 90th percentiles of the top 30 model runs (Table 4) indicates that this water balance term is not well constrained in the modelling due to insufficient data to characterise aquifer properties and inter-aquifer connectivity. For each time period the range covers both positive and negative values, which indicates the possibility of a reversal of the groundwater flow direction. However, in all three time periods the median prediction is for less upward flow under the CRDP than under the baseline, with the biggest difference on average between the baseline and the CRDP occurring between 2073 and 2102. The pattern over the 90-year simulation period is consistent with early reductions in upward flow to the alluvium being driven by depressurisation of aquifers near the surface from open-cut mining, followed by a more lagged response to depressurisation of deeper coal seams from CSG extraction, leading to larger reductions in the upward flow of groundwater to the alluvium between 2073 and 2102.
Some modelling artefacts are evident in the water balance results. Notably, differences in baseline and CRDP recharge in the period 2073 to 2102 (Table 4) are due to numerical issues with the model. Drawdown can lead to the drying out of cells at the top of the model, which the model then treats as not contributing recharge. The lower recharge under the CRDP indicates that the magnitude of drawdown is greater than under the baseline and more surface cells have dried out. Thus the reduction in annual baseflow in the third period reflects both the impact of the additional coal resource developments and a smaller recharge, the latter being an artefact of model implementation. Overall the additional coal resource developments are having only small effects on the groundwater balance and the small numerical modelling issues are not materially impacting the results.
Table 3 Mean annual surface water balance at node 6 on the Avon River for 2013 to 2042, 2043 to 2072 and 2073 to 2102 in the Gloucester subregion
For some (but not all) terms, three numbers are provided. The first number is the median, and the 10th and 90th percentile numbers follow in brackets. NM = data not modelled, ET = evapotranspiration,
Data: Bioregional Assessment Programme (Dataset 1)
Table 4 Mean annual groundwater balance for the alluvial groundwater model extent in the Avon River for 2013 to 2042, 2043 to 2072 and 2073 to 2102 in the Gloucester subregion
The first number is the median, and the 10th and 90th percentile numbers follow in brackets.
Data: Bioregional Assessment Programme (Dataset 2)
Data: Bioregional Assessment Programme (Dataset 1)
Data: Bioregional Assessment Programme (Dataset 2)
