This product provides a baseline assessment of groundwater quality in the Namoi subregion with a focus on salinity and information on selected trace elements. Water quality is assessed against national guidelines provided by the National Health and Medical Research Council (NHMRC) and the Australian and New Zealand Environment and Conservation Council (ANZECC). Information about the major ion composition of groundwater in the Namoi subregion is reported in companion product 1.1 for the Namoi subregion (Welsh et al., 2014), together with a description of the hydrogeological units and conceptual understanding of hydrodynamics in the Namoi subregion.
Groundwater chemistry data were compiled from the NSW groundwater bore database (NSW Office of Water, Dataset 1). From this database, 1569 bores had data for salinity (electrical conductivity (EC)), but only a small subset of samples had trace element data. Some supplementary data (116 bores) from the National Collaborative Framework Hydrochemical Characterisation Project – Surat Basin hydrochemistry spreadsheets (Geoscience Australia, Dataset 2) were also used for the GAB portion of the Namoi subregion. Most bores in Dataset 1 cannot be attributed to specific hydrological units. However, the bores in Dataset 2 are specific to the GAB units in the Namoi subregion. Consequently, sample data have been assigned to either GAB units or non-GAB units, noting that non-GAB units will include a small proportion of bores in Gunnedah Basin sedimentary rocks. The databases contain data from bores drilled from the early 1900s through to the present. This time span has implications for data quality, given the significant changes over the decades in how data are collected and recorded.
To assess the potential hazards associated with using groundwater in the subregion, groundwater chemistry data were compared to national water quality guidelines in which a number of possible uses were considered: human drinking water, stock drinking water and long-term irrigation (defined as up to 100 years).
Trigger values were taken from the Australian Drinking Water Guidelines (ADWG) (NHMRC, 2011) and the National Water Quality Management Strategy (NWQMS) (ANZECC, 2000). Trigger values for EC were used rather than total dissolved solids (TDS) as EC values are more widely reported in the Namoi subregion.
1.5.2.2.1 Electrical conductivity
Electrical conductivity trigger values were determined using ADWG for human consumption (NHMRC, 2011) and the NWQMS for stock and irrigation water (ANZECC, 2000). The trigger values used for EC are given in Table 14 and are derived from the TDS concentrations in the guidelines, using an approximate conversion factor of 0.64, as recommended in the guidelines. The range of EC values in the data is shown in Table 14, together with the percentage of samples that exceed the different categories in the guidelines (human consumption, irrigation and stock watering).
Table 14 Electrical conductivity in Namoi subregion compared to water guidelines
aBased on Australian Drinking Water Guidelines (NHMRC, 2011) and approximate conversion from total dissolved solids (TDS) to electrical conductivity (EC) using conversion factor 0.64. TDS greater than 900 mg/L (~1476 µS/cm) is considered poor quality drinking water.
bBased on Table 4.2.5 in the National Water Quality Management Strategy (ANZECC, 2000)
cBased on National Water Quality Management Strategy (ANZECC, 2000) and approximate conversion from TDS to EC. TDS greater than 13,000 mg/L (EC of ~20,000 µS/cm) is the maximum concentration when a decline in health of all stock would be expected (ANZECC, 2000, Table 4.3.1)
dGreat Artesian Basin (GAB)
eData: Bioregional Assessment Programme (Dataset 3)
fData: Bioregional Assessment Programme (Dataset 4)
1.5.2.2.2 Electrical conductivity distribution
The EC data were used to generate maps showing EC for the non-GAB and GAB bores in the Namoi subregion. The most recent EC value was used to generate the map, so it does not represent a single snapshot of groundwater quality at a specific time; rather, the EC values provide an indication of variation in salinity across the subregion. Where multiple records of EC were available for a bore, it was noted that the EC of the groundwater predominantly fell within the same use category (drinking, irrigation, stock or >20,000µS/cm) over time, despite small changes in absolute EC values. Consequently, the distribution of EC across the sub-region is representative of average conditions in terms of categorising the bores based on their highest value water use. There is likely to be variation in the quality of the sample analyses used to create the maps due to the archival nature of the data. Factors affecting archival data can include use of different analysis methods, improvements in analysis technology over time, analysis accuracy and precision, variations in sample collection methodologies, and different bore construction techniques and quality. In an effort to reduce the effect of the archival nature of the data, only samples collected after 1970 have been included in Figure 17 and Figure 18.
Non-Great Artesian Basin groundwater
The EC data presented in Figure 17 show that groundwater in the Namoi subregion is generally suitable for drinking and irrigation purposes. Areas of higher salinity groundwater are in the Upper Namoi and the western half of the Lower Namoi alluvial systems.
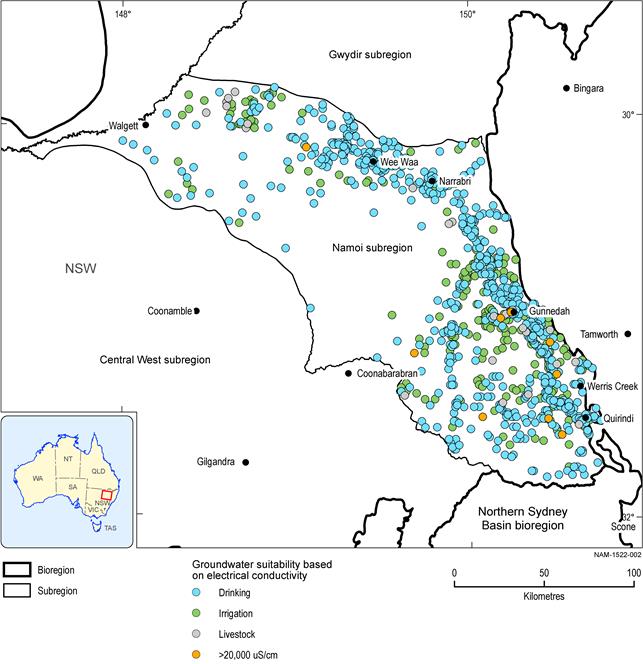
Data: Bioregional Assessment Programme (Dataset 3)
Great Artesian Basin groundwater
Figure 18 shows that groundwater EC levels in bores screened in the GAB are also generally suitable for drinking and irrigation purposes, with small areas of higher salinity groundwater in the north-west of the subregion. Whilst some bores had a single EC reading greater than 20,000 µS/cm, when results were averaged across each bore, no bores averaged EC values in exceedance of the guidelines for livestock watering.
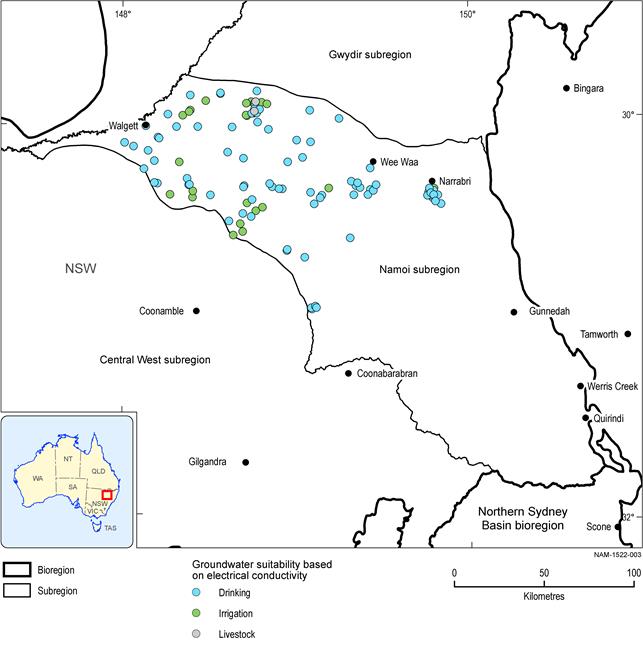
Date of sample analysis was not available for the majority of records
Data: Bioregional Assessment Programme (Dataset 4)
1.5.2.2.3 Trace elements
Exceedances for the trace elements available in the dataset were determined using the ADWG for human consumption (NHMRC, 2011) and NWQMS (ANZECC, 2000) for stock watering and irrigation water. Trace element trigger values and the percentage of analyses in exceedance of the guidelines in the non-GAB dataset are summarised in Table 15 and in Table 16 for the GAB dataset. Over 20% of samples from non-GAB bores show exceedances of drinking water guidelines for aluminium, iron, manganese, nickel and lead, however the groundwater is generally suitable for stock watering. The results from the GAB bores show exceedances of the drinking water guidelines primarily for iron, fluorine and manganese.
Table 15 Number of analyses and exceedances for trace elements in non-Great Artesian Basin groundwater of the Namoi subregion
aTable 3.4.1 in Australian Drinking Water Guidelines (NHMRC, 2011)
bTable 4.2.10 in National Water Quality Management Strategy (ANZECC, 2000)
cTable 4.3.2 in National Water Quality Management Strategy (ANZECC, 2000)
dBelow detection limit
eAesthetic water quality trigger (not health related)
fUranium values are in parts per billion
NA means ‘data not available’
Data: Bioregional Assessment Programme (Dataset 5)
Table 16 Number of analyses and exceedances for trace elements in Great Artesian Basin groundwater of the Namoi subregion
aTable 3.4.1 in Australian Drinking Water Guidelines (NHMRC, 2011)
bTable 4.2.10 in National Water Quality Management Strategy (ANZECC, 2000)
cTable 4.3.2 in National Water Quality Management Strategy (ANZECC, 2000)
dBelow detection limit
eAesthetic water quality trigger (not health related)
fUranium values are in parts per billion
NA means ‘data not available’
Data: Bioregional Assessment Programme (Dataset 4)
1.5.2.2.4 Gaps
The quality of the hydrochemistry data available for this assessment is difficult to determine, as analytical uncertainties are not reported in the dataset. The dataset includes chemical analyses of differing ages, sometimes decades apart, which will have differing levels of accuracy and precision. Additionally, bore screening interval data are unknown and stratigraphic unit information was not assigned in the database.
A number of potentially harmful trace elements have been omitted from this product due to scarcity or absence of data. Some elements have data available for only one or two sample points, while others have no data available at all. There is also a scarcity of the concentrations of a range of organic compounds in groundwater, such as polycyclic aromatic hydrocarbons, as hydrocarbons are not routinely measured in groundwater in the Namoi subregion.
Trace elements for which there was only limited data for groundwater outside the GAB are cobalt, chromium, molybdenum, and uranium. Trace elements for which there are no data for groundwater outside the GAB are arsenic, beryllium, cadmium, mercury, silver, vanadium and selenium.
Trace elements for which there was only limited data in the GAB are aluminium, copper, lead, manganese, uranium, vanadium and zinc. Trace elements for which there are no data in the GAB are arsenic, beryllium, cadmium, chromium, cobalt, mercury, molybdenum, nickel, nitrate, silver and selenium.
References
ANZECC (2000) National Water Quality Management Strategy: Paper No 4 – Australian and New Zealand guidelines for fresh and marine water quality: Volume 1 – The Guidelines. Australian and New Zealand Environment and Conservation Council and the Agriculture and Resource Management Council of Australia and New Zealand, Commonwealth of Australia, Australia.
NHMRC (2011) Australian Drinking Water Guidelines Paper 6 National Water Quality Management Strategy. National Health and Medical Research Council, National Resource Management Ministerial Council, Commonwealth of Australia, Canberra.
Welsh W, Hodgkinson J, Strand J, Northey J, Aryal S, O’Grady A, Slatter E, Herron N, Pinetown K, Carey H, Yates G, Raisbeck-Brown N and Lewis S (2014) Context statement for the Namoi subregion. Product 1.1 from the Northern Inland Catchments Bioregional Assessment. Department of the Environment, Bureau of Meteorology, CSIRO and Geoscience Australia, Australia. Viewed 01 July 2015, http://data.bioregionalassessments.gov.au/product/NIC/NAM/1.1.
Datasets
Dataset 1 NSW Office of Water (2013) NoW Namoi Water Quality - groundwater. Bioregional Assessment Source Dataset. Viewed 9 March 2015, http://data.bioregionalassessments.gov.au/dataset/0a7879bb-53d3-46c8-95e6-74dd05b3c161.
Dataset 2 Geoscience Australia (2014) Geoscience Australia, National Collaborative Framework Hydrochemical Characterisation Project – Surat Basin Hydrochemistry Spreadsheets. Bioregional Assessment Source Dataset. Viewed 9 March 2015, http://data.bioregionalassessments.gov.au/dataset/8e5cade2-c95a-45ec-9e6e-39b136d2b6d6.
Dataset 3 Bioregional Assessment Programme (2015) Namoi NSW Office of Water groundwater EC (sampled post 1970). Bioregional Assessment Derived Dataset. Viewed 23 September 2015, http://data.bioregionalassessments.gov.au/dataset/b5dd0f26-1afa-4a86-8c41-0ed56f86843e.
Dataset 4 Bioregional Assessment Programme (2015) Namoi Great Artesian Basin groundwater chemistry. Bioregional Assessment Derived Dataset. Viewed 23 September 2015, http://data.bioregionalassessments.gov.au/dataset/0c811dba-a23f-4616-afc6-93520134c7fb.
Dataset 5 Bioregional Assessment Programme (2015) NSW Office of Water groundwater quality bores – Namoi. Bioregional Assessment Derived Dataset. Viewed 24 November 2015, http://data.bioregionalassessments.gov.au/dataset/2e172e60-c952-4078-8041-ef8bd910ce59.
