This product summarises water accounts in the Namoi river basin for the water years (year starting in July and ending in June) 2004–05 to 2011–12, for which all publicly available data used here overlapped. A water account provides a summary of resource availability for a defined area through quantifying storage volumes, inflows and outflows within a management framework. Surface water streamflow (either as inflows or outflows into a basin or subregion) is the result of numerous – natural and anthropogenic – interacting processes, and provides the most complete estimate of water availability. On the other hand, surface water diversions provide the most complete estimate of water use for productive activities (irrigation, mining, town water supply). Both are routinely monitored in the Namoi and may be impacted by current coal and coal seam gas (CSG) development and exploration; hence they form the basis of the water accounts. The accounts are specifically intended to estimate current water availability and use patterns. They rely on observed rather than modelled data wherever possible, as there would be uncertainty associated with modelled estimates and propagation of errors from model assumptions (Kirby et al., 2008). Publicly available information on water use is only available for the river basin, hence this product conducts the account for the entire basin. The time period 2004–05 to 2011–12 applies for all analyses conducted here, unless stated otherwise. The water accounts are thus indicative of recent climate conditions and water use practices.
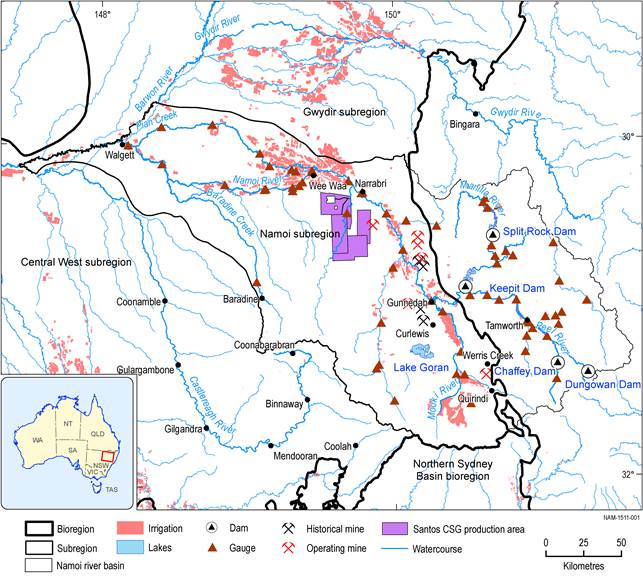
The Namoi River, located in north-eastern NSW, drains an area of 42,000 km2 from east to west from its headwaters in the Great Dividing Range (CSIRO, 2007). The Namoi subregion is smaller than the Namoi river basin because the eastern part of the river basin, which includes three large dams, does not overlie a coal-bearing geological basin (Welsh et al., 2014). Further details on the Namoi river basin and the Namoi subregion, including the proportion of the river within the subregion, are given in companion product 1.1 for the Namoi subregion (Welsh et al., 2014). Current coal and CSG development and exploration which may impact water resources are primarily located in the central and eastern parts of the subregion (Geoscience Australia, Dataset 1). Detailed information about coal and CSG development is provided in companion product 1.2 for the Namoi subregion (Northey et al., 2014). Figure 3 shows a detailed stream network, storages, gauging stations, major land uses and current and potential coal mines and CSG developments in the subregion. The major tributaries of the river upstream of Narrabri are the Peel, Manilla, McDonald and Mooki rivers and Coxs Creek. The tributaries downstream of Narrabri are Pian (anabranch), Gunidgera (anabranch), and Baradine and Bohena creeks (Green et al., 2011). There are numerous other minor tributaries.
Flows in the Namoi river basin are highly regulated. Long-term hydrometric records (see CSIRO, 2007) indicate that Split Rock Dam regulates 93% of all dam inflows and Keepit Dam regulates 77% of all dam inflows. Flows in the Peel River are less regulated with Chaffey Dam regulating 41% of all dam inflows (CSIRO, 2007). The long-term mean annual flow (1970–2011) in the Namoi River at Gunnedah downstream of Keepit Dam is about 620 GL/year whereas at Goangra (46 km upstream of the end-of-system at Walgett) it is about 563 GL/year (NSW Office of Water, Dataset 2). The reduction of flow is due to the presence of weirs and surface water diversions mainly used for irrigation and in-stream losses (evaporation and leakage to groundwater). About 51% (714 km2) of irrigation in the Namoi river basin is located between Gunnedah and Walgett, about 10 km upstream of the junction of the Namoi and Barwon rivers (Department of Agriculture: Australian Bureau of Agricultural and Resource Economics and Sciences, Dataset 3) (Figure 3). The long-term mean annual flow (1973–2011) of the Peel River is 235 GL/year (NSW Office of Water, Dataset 2).
There are major unregulated tributaries upstream of Split Rock Dam including the Manilla and Upper Namoi rivers. The Mooki River (which joins the Namoi River at Gunnedah) and Bundella and Coxs creeks (which join the Namoi River at Boggabri) are also unregulated; as well as the lower section of Pian Creek and Lake Goran catchment (NSW Government, 2012) (Figure 3). Extensive irrigation (about 53 km2) – much of it large scale – occurs in the Mooki River (and tributaries), Coxs Creek and Pian Creek catchments (Department of Agriculture: Australian Bureau of Agricultural and Resource Economics and Sciences, Dataset 3).
The baseline diversion limit was estimated at 508 GL/year but a reduction of 10 GL/year equated to a new sustainable diversion limit of 498 GL/year (the Commonwealth’s Basin Plan 2012). The average annual cap target (which depends on climate conditions and water stored in dams) from 2005–06 to 2011–12 was 241 GL/year, highlighting the recent dry conditions (MDBC, 2006; MDBC, 2007; MDBC, 2008a; MDBA, 2009; MDBA, 2010; MDBA, 2011; MDBA, 2012).
The mean annual surface water diverted from 2005–06 to 2011–12 was 278 GL, with 271 GL/year (97%) used in irrigation and 7 GL/year (3%) used for domestic or other purposes. On average, 84 GL/year of surface water diverted to agriculture in unregulated rivers are unmetered estimates (MDBC, 2006; MDBC, 2007; MDBC, 2008a; MDBA, 2009; MDBA, 2010; MDBA, 2011; MDBA, 2012). These diversions in unregulated rivers represent about 30% of mean annual surface water diversions across the basin. Further increase in surface water diversions is restricted under current water plans.
The remainder of this product describes:
- water volumes held in surface water storages, inflows and outflows
- gauged inflows and outflows
- surface water permits and allocations
- surface water diversions
- data gaps.
Data: Geoscience Australia (Dataset 1), information current as of December 2012; Department of Agriculture: Australian Bureau of Agricultural and Resource Economics and Sciences (Dataset 3); Bureau of Meteorology (Dataset 6); DTIRIS, Resources and Energy, Minerals Division Titles Branch (Dataset 7)
1.5.1.1.1 Water accounts in the Namoi river basin
There are three major dams in the Namoi river basin: Chaffey Dam (capacity of 62 GL), Keepit Dam (423 GL), and Split Rock Dam (397 GL) (MDBA, 2010). All three lie outside of the Namoi subregion (Figure 3). These dams supply water to irrigators, the main water users in the basin, although Keepit Dam was originally built for flood mitigation. A smaller dam (Dungowan Dam, 6 GL, on Dungowan Creek in the Peel River system) supplies water to the city of Tamworth – the largest urban centre in the basin. Additionally, there are about 32,000 farm dams spread across the Namoi river basin (MDBC, 2008b), which divert about 160 GL/year (the Commonwealth’s Basin Plan 2012). Storage volumes for 2004–05 to 2011–12 are summarised in Table 3. The mean annual volume was 40.4 GL (range 17 to 62 GL) in Chaffey Dam, 144.3 GL (range 24 to 416 GL) in Keepit Dam and 55.3 GL (range 13 to 108 GL) in Split Rock Dam. The combined mean annual storage was 239.9 GL (range 54 to 561 GL).
Table 3 Storage volumes at the start (July) of the water year, inflows and outflows for dams in the Namoi river basin
Data: MDBC (2006, 2007, 2008a); MDBA (2009, 2010, 2011, 2012); NSW Office of Water (Dataset 2)
Mean inflows and outflows for Chaffey Dam were 3.0 GL/year and 2.8 GL/year, respectively. For Keepit Dam, inflows and outflows were 18.6 GL/year and 13.0 GL/year, respectively; and inflows and outflows for Split Rock Dam were 2.8 GL/year and 1.7 GL/year, respectively. Inflows reported here correspond to gauged streamflow in a station or stations upstream of the dam. Other sources of inflows and outflows such as local runoff, rainfall on the reservoir surface and evapotranspiration from the reservoir surface also account for differences in yearly total storage.
Gauged inflows and outflows
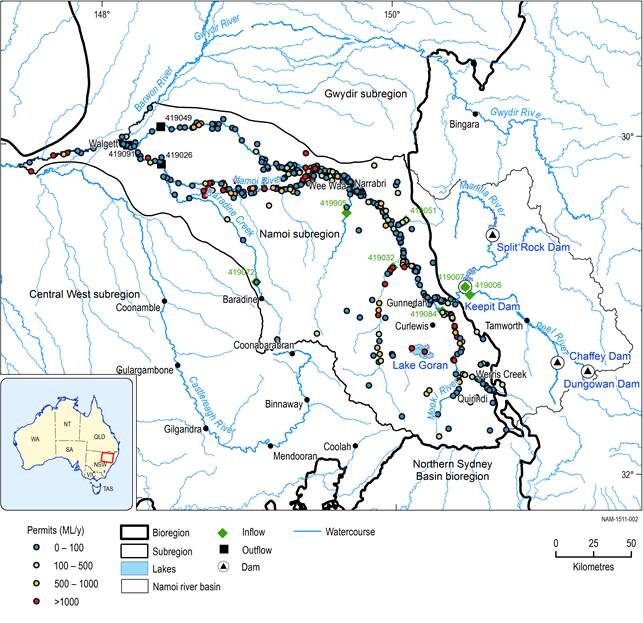
Gauged inflows to the Namoi subregion include flows released from Keepit Dam and six contributing streams and creeks (Figure 4). Details and mean annual flows for stations in these tributaries are summarised in Table 4. There are numerous minor tributaries which are ungauged, were previously gauged and the corresponding gauging station has now closed, or where the streamflow records were of short duration and/or with gaps (see companion product 1.1 for the Namoi subregion (Welsh et al., 2014) for further details on gauging stations). Mean annual inflows for 2004-05 to 2011-12 were 72.5 GL/year (NSW Office of Water, Dataset 2).
Mean annual end-of-system flows (Table 4) for 2004-05 to 2011-12 were 483 GL/year (NSW Office of Water, Dataset 2). End-of-system flows are normally measured at station 419091 (Walgett) on the Namoi River (Figure 4). For 2010-11 and 2011-12 the end-of-system measurement was taken at station 419026 (Namoi River at Goangra, Figure 4) as the Walgett gauge was affected by backwater effects from the Barwon River for most of the year (State Water, 2011). Water may be also diverted to Pian Creek via Knights Weir. Mean annual outflows in station 419049 (Pian Creek at Waminda, Figure 4) were 68 GL/year (NSW Office of Water, Dataset 2) (Table 4). Mean total outflows for the period were 551 GL/year (Table 4).
Data: Bioregional Assessment Programme (Dataset 4); Bureau of Meteorology (Dataset 6)
Table 4 illustrates large inter-annual variability for the water account period (2004-05 to 2011-12). During the 2001-2009 Millennium Drought (van Dijk et al., 2013), lower than average precipitation and inflows into reservoirs resulted in decreased streamflow in the Namoi river basin. Reservoir storage was at its lowest in 2007-08. The drought ended in 2010 with heavy rainfall caused by strong La Niña conditions (Webb, 2012).
Table 4 Mean annual streamflow for stations with inflows and outflows into the Namoi subregion
aData missing from October 2011 onwards
bEnd-of-system flows for 2010-11 and 2011-12 was taken at station 419026 (Namoi River at Goangra) as Walgett gauge was affected by backwater from the Barwon River for most of the year (State Water, 2011)
Data: NSW Office of Water (Dataset 2)
Surface water permits and allocations
Total surface water permits in the regulated rivers of the Namoi river basin amount to approximately 424 GL/year of which 1.4 GL/year (less than 1%) are high security (i.e. water permit holders receive their full permit allocation in all but severe drought periods), 286 GL/year (68%) are general security (i.e. water permit holders receive their allocation based on water resource availability), 2.2 GL/year (less than 1%) are for domestic and stock, 19 GL/year (4%) are for local water utilities and 115 GL/year (27%) are supplementary permits (Green et al., 2011). Water permits in the unregulated rivers amount approximately to 117 GL/year, making a total of approximately 541 GL/year in both regulated and unregulated sections (NSW’s Water Sharing Plan for the Namoi Unregulated and Alluvial Water Sources 2012; Burrell et al., 2013). In the Namoi subregion, water permits amount to approximately 467 GL/year (Bioregional Assessment Programme, Dataset 4). Table 5 summarises surface water permits (within the Namoi subregion) by purpose and Table 6 by type and water source.
Table 5 Surface water permits grouped by purposea in the Namoi subregion
aThere were twelve additional water permits of miscellaneous purpose with no share volume including augmentation, conveyancing, dewatering, industrial and pisciculture, and recirculation.
Data: Bioregional Assessment Programme (Dataset 4)
Table 6 Surface water permitsa,b grouped by river or creek in the Namoi subregion
aThere were four additional permits with no determined water source nor share volumes
bAll surface water permits are water access right which refers to the right conferred by law to hold or take water from a water resource
Data: Bioregional Assessment Programme (Dataset 4)
Figure 5 summarises allocations to water permits for 2004-05 to 2011-12. Generally, basic rights, domestic and stock, local water utilities and high security licences received 100% of entitlements each water year (NSW Office of Water, Dataset 5). A continuous accounting allocation system is used for general security licences in the regulated section of the Namoi river basin. Each individual water permit can hold up to 200% licensed allocation volume, including credit for unused allocation in previous years. In any particular season, the volume of water that each water permit can use is limited to a maximum of 125% of licensed permit with a maximum of 300% over any 3 years. In every water year from 2004-05 to 2009-10 general security entitlements received less than 100% allocation due to drought conditions. This meant that the general security carryover (water credited from previous water years) in 2011-12 resulted in an allocation of 112%, the highest since the system began management under NSW's Water Management Act 2000 (Burrell et al., 2013).
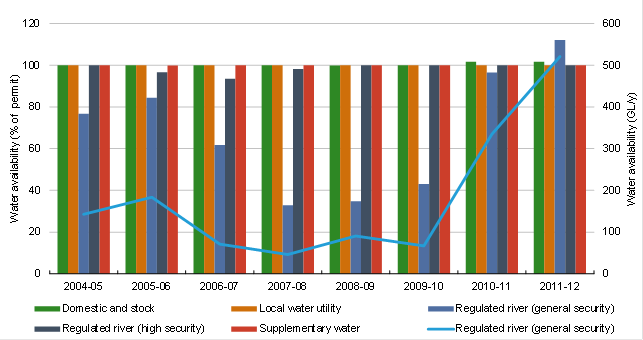
Figure 5 Namoi regulated river percentage water availability per water permit type (bars)
Blue line on secondary y-axis represents the total water availability for general security water permits, which is the volume credited including the allocation at the beginning of the water year plus unused water carried forward from previous years.
Data: NSW Office of Water (Dataset 5)
Surface water diversions
Diversions are monitored in the regulated part of the Namoi river basin whereas there is no monitoring in the unregulated part of the basin and diversions are estimated (MDBA, 2010). Every water year, a limit or cap to water diversions is determined based on water availability using the Namoi IQQM (Integrated Quantity Quality Model; Simons et al., 1996). Each water year, the cap is estimated as the amount of diversions that would have occurred under management rules and irrigation development at 1993-94 levels (MDBA, 2010). Figure 6 shows the basin annual diversions per sector for 2004-05 to 2011-12 as well as the annual cap targets. The mean annual surface water diverted from 2004-05 to 2011-12 was 278 GL, with 271 GL/year (97%) used in irrigation and 7 GL/year (3%) used for domestic or other purposes. On average, 84 GL/year (30%) of surface water diverted to agriculture in unregulated rivers are unmetered estimates (Figure 6). Diversions in most water years were lower than their corresponding cap targets, except for 2006-07 when the cap was exceeded and cap credits from previous years had to be used (MDBC, 2008a).
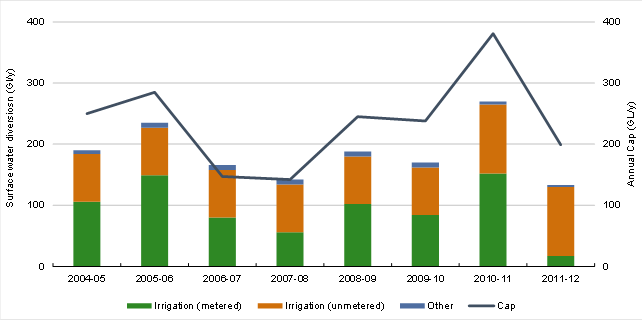
Figure 6 Namoi river basin diversions by purpose (bars)
'Other' diversions include domestic, stock, industry and town water supply. Dark blue line in secondary y-axis represents annual cap diversion target.
Data: MDBC (2006, 2007, 2008a); MDBA (2009, 2010, 2011, 2012). Data for 2011-2012 sourced from Burrell et al. (2013)
1.5.1.1.2 Gaps
There are several additional water sources and volumes that require additional calculations or models to be determined, including:
- mean river channel storage
- reservoir and river channel rainfall and evaporation
- ungauged tributary inflow
- ungauged runoff
- surface water – groundwater interactions.
Some of the sources not included here are implicitly considered; for example, reservoir rainfall and evaporation would be reflected in changes in the storage volume. Where possible, there is scope for estimating and reporting these volumes as part of surface water numerical modelling in companion product 2.6.1 for the Namoi subregion.
Burrell M, Moss P, Petrovic J and Ali A (2013) General Purpose Water Accounting Report 2011 2012: Namoi Catchment. NSW Department of Primary Industries, Sydney. Viewed 24 April 2015, http://www.water.nsw.gov.au/__data/assets/pdf_file/0011/548840/avail_water_accounting_report_namoi_11_12.pdf.
CSIRO (2007) Water availability in the Namoi. A report to the Australian Government from the CSIRO Murray-Darling Basin Sustainable Yields Project. CSIRO, Australia. Viewed 10 December 2014, http://www.csiro.au/Organisation-Structure/Flagships/Water-for-a-Healthy-Country-Flagship/Sustainable-Yields-Projects/MDBSY-Namoi-report.aspx.
Green D, Petrovic J, Moss P and Burrell M (2011) Water resources and management overview: Namoi catchment. New South Wales Office of Water, Department of Primary Industries, Sydney. Viewed 10 December 2014, http://www.water.nsw.gov.au/ArticleDocuments/34/catchment_overview_namoi.pdf.aspx.
Kirby J, van Dijk A, Mainuddin M, Peña-Arancibia J, Guerschman J, Liu Y, Marvanek S, McJannet DL, Paydar Z, McVicar TR, van Niel TG and Li LT (2008) River water balance accounts across the Murray-Darling Basin, 1990-2006. A report to the Australian Government from the CSIRO Murray-Darling Basin Sustainable Yields Project, CSIRO Australia. Viewed 7 January 2016 https://publications.csiro.au/rpr/download?pid=procite:572842b6-15c2-4115-89a2-a59c41aba33f&dsid=DS1.
MDBA (2009) Water Audit Monitoring Report 2007-08. Murray-Darling Basin Authority, Canberra, Australia. Viewed 10 December 2014, http://www.mdba.gov.au/sites/default/files/pubs/Water-Audit-Monitoring-Report-2007-08.pdf.
MDBA (2010) Water Audit Monitoring Report 2008-09. Murray-Darling Basin Commission, Canberra, Australia. Viewed 10 December 2014, http://www.mdba.gov.au/sites/default/files/pubs/MDBA_WaterAuditReport_Web_B.pdf.
MDBA (2011) Water Audit Monitoring Report 2009-10. Murray-Darling Basin Authority, Canberra, Australia. Viewed 10 December 2014, http://www.mdba.gov.au/sites/default/files/pubs/MDBA-13971-WAM-Report-2009-10_WEB.pdf.
MDBA (2012) Water Audit Monitoring Report 2010-11. Murray-Darling Basin Authority, Canberra, Australia. Viewed 10 December 2014, http://www.mdba.gov.au/sites/default/files/pubs/Water_Audit_Report_2010-11_web_FA.pdf.
MDBC (2006) Water Audit Monitoring Report 2004/05. Murray-Darling Basin Commission, Canberra, Australia. Viewed 10 December 2014, http://www.mdba.gov.au/sites/default/files/archived/cap/WAM-Report-2004-05.pdf.
MDBC (2007) Water Audit Monitoring Report 2005/06. Murray-Darling Basin Commission, Canberra, Australia. Viewed 10 December 2014, http://www.mdba.gov.au/sites/default/files/archived/cap/WAM-report-2005-06.pdf.
MDBC (2008a) Water Audit Monitoring Report 2006/07. Murray-Darling Basin Commission, Canberra, Australia. Viewed 10 December 2014, http://www.mdba.gov.au/sites/default/files/archived/cap/MDBC_WAM_2006-07.pdf.
MDBC (2008b) Mapping the growth, location, surface area and age of man made water bodies, including farm dams, in the Murray-Darling Basin. Murray-Darling Basin Commission, Canberra, Australia. Viewed 31 August 2015, http://www.mdba.gov.au/sites/default/files/archived/mdbc-RTSWR-reports/2136_Farm_Dams_in_the_MDB.pdf.
Northey J, Pinetown K and Sander R (2014) Coal and coal seam gas resource assessment for the Namoi subregion. Product 1.2 for the Namoi subregion from the Northern Inland Catchments Bioregional Assessment. Department of the Environment, Bureau of Meteorology, CSIRO and Geoscience Australia, Australia. Viewed 01 July 2015, http://data.bioregionalassessments.gov.au/product/NIC/NAM/1.2.
Simons M, Podger G and Cooke R (1996) IQQM – a hydrologic modelling tool for water resources and salinity management. Environmental Software, 11, 185-192.
State Water (2011) Water balance reports, State Water Corporation. Viewed 10 December 2014, http://www.statewater.com.au/Water%20delivery/Water%20balance%20reporting.
van Dijk A, Beck H, Crosbie R, de Jeu R, Liu Y, Podger G, Timbal B, Viney N (2013) The Millennium Drought in southeast Australia (2001–2009): Natural and human causes and implications for water resources, ecosystems, economy, and society. Water Resources Research, 49(2), 1040–1057. DOI: 10.1002/wrcr.20123.
Webb M (2012) Seasonal climate summary southern hemisphere (summer 2011–12): A mature La Niña, strongly positive SAM and active MJO. Australian Meteorological and Oceanographic Journal, 62(4), 335–349.
Welsh W, Hodgkinson J, Strand J, Northey J, Aryal S, O’Grady A, Slatter E, Herron N, Pinetown K, Carey H, Yates G, Raisbeck-Brown N and Lewis S (2014) Context statement for the Namoi subregion. Product 1.1 from the Northern Inland Catchments Bioregional Assessment. Department of the Environment, Bureau of Meteorology, CSIRO and Geoscience Australia, Australia. Viewed 01 July 2015, http://data.bioregionalassessments.gov.au/product/NIC/NAM/1.1.
Dataset 1 Geoscience Australia (2013) OZMIN Mineral Deposits Database. Bioregional Assessment Source Dataset. Viewed 26 March 2015, http://data.bioregionalassessments.gov.au/dataset/34247a24-d3cf-4a98-bb9d-81671ddb99de.
Dataset 2 NSW Office of Water (2014) Namoi Inflow and outflows for storages and selected gauges. Bioregional Assessment Source Dataset. Viewed 26 November 2015, http://data.bioregionalassessments.gov.au/dataset/8fa84728-6dde-4e79-b711-2a7951d3015d.
Dataset 3 Department of Agriculture: Australian Bureau of Agricultural and Resource Economics and Sciences (2014) Catchment Scale Land Use of Australia - 2014. Bioregional Assessment Source Dataset. Viewed 26 March 2015, http://data.bioregionalassessments.gov.au/dataset/6f72f73c-8a61-4ae9-b8b5-3f67ec918826.
Dataset 4 Bioregional Assessment Programme (2014) Namoi Location of surface water licences. Bioregional Assessment Derived Dataset. Viewed 26 November 2015, http://data.bioregionalassessments.gov.au/dataset/268f3af1-5b92-46be-b332-870e642470b5.
Dataset 5 NSW Office of Water (2015) Upper and Lower Namoi Regulated River Water Sources, 2004-05 to 2013-14. Bioregional Assessment Source Dataset. Viewed 26 March 2015, http://data.bioregionalassessments.gov.au/dataset/5c921ce9-2a03-4731-a703-cae4624e48d2.
Dataset 6 Bureau of Meteorology (2013) National Surface Water sites Hydstra. Bioregional Assessment Source Dataset. Viewed 18 May 2015, http://data.bioregionalassessments.gov.au/dataset/f7edc5e5-93ee-4527-bed5-a118b4017623.
Dataset 7 DTIRIS, Resources and Energy, Minerals Division Titles Branch (2014) NSW Petroleum Title Applications 20140815. Bioregional Assessment Source Dataset. Viewed 06 November 2015, http://data.bioregionalassessments.gov.au/dataset/6e48176e-6454-4939-bae9-23118c8b3d2f.
