This product summarises surface water quality information in the Namoi river basin. Surface water quality may be directly impacted by runoff from areas altered by coal or coal seam gas (CSG) development (areas cleared of vegetation, service roads, and site processing facilities), discharge of mine or CSG waters and leaking of hydrocarbons. In addition, induced changes in streamflow as a result of large coal mining or CSG development may impact surface water quality as well. A number of physical and chemical hydrological parameters may be altered by current and potential coal and CSG development, including turbidity, suspended solids, pH, heavy metal concentrations, salinity, and the presence of hydrocarbons.
The NSW Office of Water conducts two types of monitoring: continuous monitoring at river gauging stations and targeted monitoring campaigns for a specific duration and purpose (NSW Office of Water, 2014a). Companion product 1.1 for the Namoi subregion (Welsh et al., 2014) summarised results of the Namoi Water Quality Project (NWQP) (Mawhinney, 2011), undertaken from 2002 to 2007. The NWQP focused on quality parameters related to agriculture (salinity, nutrient and pesticide concentrations, among others). It found that the water quality in the Namoi River and its tributaries was generally acceptable for irrigation and other farming activities, although several parameters (salinity, phosphorus and nitrogen) did not meet default trigger values for the protection of aquatic ecosystems in south-eastern Australia set out in guidelines for water quality by the Australian and New Zealand Environmental and Conservation Council and Agriculture and Resource Management Council of Australia and New Zealand (ANZECC and ARMCANZ, 2000). If trigger values are exceeded for a pollutant, a site-specific investigation is ‘triggered’ following the ANZECC and ARMCANZ guidelines. Future water quality assessments will be conducted using water quality targets set out in the Commonwealth’s Basin Plan 2012.
The remainder of this product includes:
- a description of the water quality parameters available from the NSW Office of Water’s continuous monitoring gauging station network (NSW Office of Water, 2014b)
- water quality parameters available in the Namoi river basin from the continuous monitoring gauging station network (NSW Office of Water, Dataset 1).
1.5.2.1.1 Water quality in the Namoi river basin
Water quality parameters available from the NSW Office of Water continuous monitoring network include long-term records of salinity, turbidity and water temperature (NSW Office of Water, 2014b).
Salinity is measured by the ability of soluble salts to transmit an electric current (electrical conductivity or EC) quantified in microSiemens per centimetre (µS/cm). The default trigger value in the Namoi uplands (from the top of the Great Dividing Range to the junction of the Peel and Namoi rivers immediately below Keepit Dam) is set at 350 µS/cm, whereas for the lowlands (from Gunnedah to the junction with the Barwon River at Walgett) it is set at 300 µS/cm (ANZECC and ARMCANZ, 2000).
Turbidity is a proxy for the amount of total suspended solids in water – the murkier or muddier it appears, the higher the measured turbidity. Turbidity is measured in Nephelometric Turbidity Units (NTU). The ANZECC and ARMCANZ (2000) default trigger value in the lowlands of the Namoi river basin is set at 50 NTU.
Temperature (°C) is monitored for instances of cold water pollution, which is an artificial decrease in the temperature of river water in a natural ecosystem. It occurs when stored cold water is released reducing the natural temperature of the river downstream (NSW Office of Water, 2014b), which may impact river ecosystems. This reduction in temperature mainly occurs when releases are made from large dams bound by walls higher than 15 m (Preece, 2004). Large coal mining operations generally do not have dams with walls higher than 15 m, thus are unlikely to cause cold water pollution, hence these data will not be analysed in the remainder of this product. Temperature is also used to assess surface water and groundwater interactions (e.g. Andersen and Acworth, 2009). Temperature maybe more stable in a gaining stream (i.e. a stream that gains water from local groundwater as it flows downstream), whereas it may fluctuate more with changes in atmospheric temperature in a losing stream (i.e. stream that loses water as it infiltrates from the river bed to the local groundwater, see Loheide and Gorelick, 2006).
Table 13 summarises the gauging stations and dates for which the above-described water quality parameters are available in the NSW Office of Water continuous monitoring network. Figure 15 shows the geographical location and parameters measured at each gauging station.
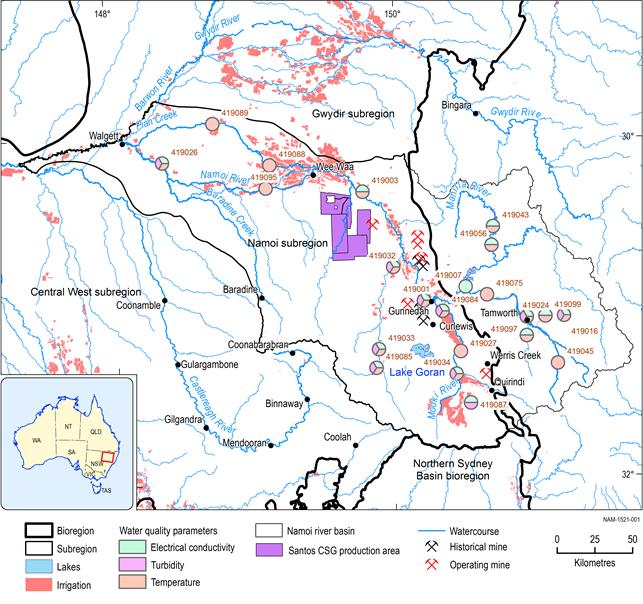
Data: Geoscience Australia (Dataset 2), information current as of December 2012; Department of Agriculture: Australian Bureau of Agricultural and Resource Economics and Sciences (Dataset 3); Bioregional Assessments Programme (Dataset 4), DTIRIS, Resources and Energy, Minerals Division Titles Branch (Dataset 5)
There are 22 gauging stations with surface water quality data, 21 are reported as operational at the time of writing (NSW Office of Water, Dataset 1). Nine are reported as measuring EC, temperature and turbidity. There are five gauging stations with long (i.e. >10 years) records for EC and temperature (Table 13). Turbidity was measured at ten gauging stations, but measurements often lasted for less than three years (Table 13). It is noted that even if a gauging station is reported as operational, data may be missing or of poor quality for long periods.
Table 13 Gauging stations and dates of availabilitya for surface water quality parameters including electrical conductivity, turbidity and temperature
Gauging stations with more than ten years of data for electrical conductivity and temperature are indicated in bold type. Data years are calculated as the number of days with data divided by 365.25.
aEnd dates are not always indicative of end of records, but of cut-off dates for inclusion in published datasets
NA denotes parameter not measured at the station
Data: NSW Office of Water (Dataset 1)
Figure 16 shows time series of daily mean EC and streamflow (Dataset 6) for the water year (year starting in July and ending in June) 2010–11, which was a year with rainfall higher than the mean (Ganter, 2011). EC values remain higher than the trigger value for the protection of aquatic ecosystems (300 µS/cm) for much of the year. Values drop below the trigger value only after salt in the landscape is mobilised by flows higher than 100 ML/day. The mean daily value for 2010–11 was about 390 µS/cm.
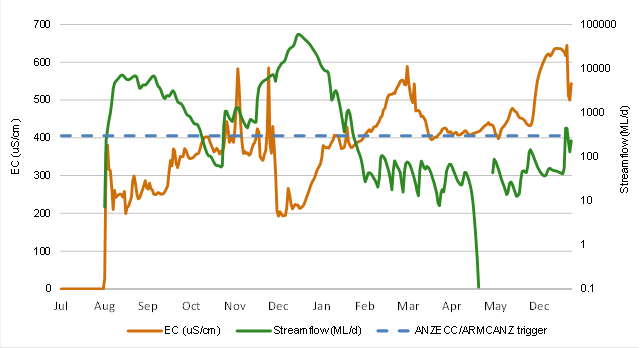
Electrical conductivity (EC), shown by brown line, and streamflow (green line). The ANZECC/ARMCANZ default trigger value for the protection of aquatic ecosystems of 300 µS/cm is frequently exceeded. Note the secondary logarithmic y-axis for streamflow.
Data: NSW Office of Water (Dataset 6)
Data from the NSW Office of Water (Dataset 1) shows that turbidity at gauging station 419026 was measured only from April 1996 to March 1998; whereas NWQP measurements occurred from 2002 to 2007 (Mawhinney, 2011). The mean daily NTU according to NSW Office of Water (Dataset 1) was 141 (range zero to 443), which grossly exceeds the ANZECC and ARMCANZ (2000) trigger value of 50 NTU.
1.5.2.1.2 Gaps
There is a lack of data on the presence of heavy metals, trace elements and hydrocarbons which could result from coal mining and CSG operation and development. Other parameters not routinely monitored include: pH, alkalinity, dissolved oxygen, and major and minor ions.
Andersen M and Acworth I (2009) Stream-aquifer interactions in the Maules Creek catchment, Namoi Valley, New South Wales, Australia. Hydrogeology Journal, 17, 2005–2021.
ANZECC and ARMCANZ (2000) Australian and New Zealand Guidelines for Fresh and Marine Water Quality. Australian and New Zealand Environment and Conservation Council and Agriculture and Resource Management Council of Australia and New Zealand.
Ganter C (2011) Seasonal climate summary southern hemisphere (winter 2010): a fast developing La Niña, Australian Meteorological and Oceanographic Journal, 61(2), 125–135.
Loheide S and Gorelick S (2006) Quantifying Stream-Aquifer Interactions through the Analysis of Remotely Sensed Thermographic Profiles and In Situ Temperature Histories. Environmental Science and Technology, 40(10), 3336-3341.
Mawhinney W (2011) Namoi Water Quality Project 2002–2007 – Final report, NSW Office of Water, Sydney. Viewed 10 December 2014, http://www.water.nsw.gov.au/ArticleDocuments/34/quality_namoi_water_quality_report.pdf.aspx.
NSW Office of Water (2014a) Two types of water quality data. New South Wales Office of Water. Viewed 10 December 2014, http://waterinfo.nsw.gov.au/wq/intro.shtml.
NSW Office of Water (2014b) Water quality. New South Wales Office of Water. Viewed 10 December 2014, http://www.water.nsw.gov.au/Water-Management/Water-quality/default.aspx.
Preece R (2004) Cold water pollution below dams in New South Wales: A desktop assessment. NSW Department of Infrastructure, Planning and Natural Resources. Sydney. Viewed 25 June 2015, http://www.water.nsw.gov.au/__data/assets/pdf_file/0004/548518/desktop_assessmnet_cold_water_pollution.pdf.
Welsh W, Hodgkinson J, Strand J, Northey J, Aryal S, O’Grady A, Slatter E, Herron N, Pinetown K, Carey H, Yates G, Raisbeck-Brown N and Lewis S (2014) Context statement for the Namoi subregion. Product 1.1 from the Northern Inland Catchments Bioregional Assessment. Department of the Environment, Bureau of Meteorology, CSIRO and Geoscience Australia, Australia. Viewed 01 July 2015, http://data.bioregionalassessments.gov.au/product/NIC/NAM/1.1.
Dataset 1 NSW Office of Water (2013) Namoi Surface Water Gauging Data. Bioregional Assessment Source Dataset. Viewed 02 September 2015, http://data.bioregionalassessments.gov.au/dataset/e82d011c-f314-4867-ae3a-31bbf342818c.
Dataset 2 Geoscience Australia (2013) OZMIN Mineral Deposits Database. Bioregional Assessment Source Dataset. Viewed 26 March 2015, http://data.bioregionalassessments.gov.au/ dataset/34247a24-d3cf-4a98-bb9d-81671ddb99de.
Dataset 3 Department of Agriculture: Australian Bureau of Agricultural and Resource Economics and Sciences (2014) Catchment Scale Land Use of Australia - 2014. Bioregional Assessment Source Dataset. Viewed 26 March 2015, http://data.bioregionalassessments.gov.au/dataset/6f72f73c-8a61-4ae9-b8b5-3f67ec918826.
Dataset 4 Bioregional Assessments Programme (2015) Namoi Hydstra surface water quality gauges (update). Bioregional Assessment Derived Dataset. Viewed 25 June 2015, http://data.bioregionalassessments.gov.au/dataset/4208c961-5a57-4246-8316-973a1712f0fc.
Dataset 5 DTIRIS, Resources and Energy, Minerals Division Titles Branch (2014) NSW Petroleum Title Applications 20140815. Bioregional Assessment Source Dataset. Viewed 06 November 2015, http://data.bioregionalassessments.gov.au/dataset/6e48176e-6454-4939-bae9-23118c8b3d2f.
Dataset 6 NSW Office of Water (2014) Namoi Water quality time series for selected stations. Bioregional Assessment Derived Dataset. Viewed 26 November 2015, http://data.bioregionalassessments.gov.au/dataset/8b11a0d6-5f97-4e17-8cd1-75bb647b321a.
