The modelling boundary (as defined in companion products 2.6.1 and 2.6.2 for the Clarence-Moreton bioregion) is smaller than the preliminary assessment extent (PAE) since the coal resource development pathway is confined to an area within the Richmond river basin. The surface water modelling area is therefore restricted to within the Richmond river basin, for which the water accounts are being reported.
The Richmond River, located in far-north NSW, drains an area of 7020 km2 from its headwaters in the Border Ranges and the Richmond Range. Further details on the Richmond river basin, including its location in the Clarence‑Moreton bioregion, are given in companion product 1.1 for the Clarence‑Moreton bioregion (Rassam et al., 2014). Current coal and CSG development and exploration, which may impact water resources are primarily located in the western part of the subregion (west of Casino). Figure 3 shows a detailed stream network, storages, irrigated land and historical coal mines in the Richmond river basin. There is a single mapped mineral deposit just outside the Richmond river basin, which is the Tabulam iron ore deposit (Figure 3). The major tributaries to the Richmond River upstream of Casino include Iron Pot and Eden creeks (Figure 3). The major tributaries to the Richmond River downstream of Casino include Wilsons River and Coopers, Terania, Leycester, Sandy and Bungawalbin creeks and Shannon Brook. There are numerous other minor tributaries.
Water storages in the basin include Toonumbar Dam (capacity 11 GL excluding flood storage), which stores water for hydro-power, irrigation, stock and town water; and Rocky Lake (capacity 14 GL excluding flood storage), which provides water for the towns of Lismore and Ballina. There are four weir structures on the Richmond River near Casino and one on the Wilsons River that provides water to Mullumbimby in the Brunswick river basin. Irrigated pastures are found around the alluvial flats of the Richmond and Wilson rivers and groundwater is used to irrigate fruit and nut crops on the Alstonville Plateau. With only two main water storages and a few weirs, most of the flows in the Richmond river basin are largely unregulated.
The remainder of this product describes:
- water volumes held in surface water storages
- surface water permits and allocations
- data gaps.
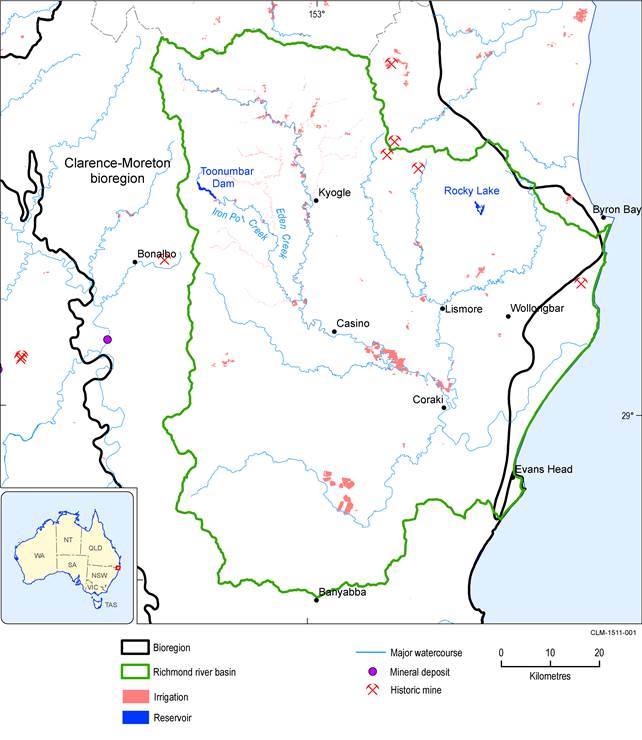
Figure 3 Tributaries of the Richmond River, town centres, irrigation areas and historical coal mines
Data: Streamflow gauge locations obtained from NSW Office of Water (2015). Coal mine and resource data sourced from the OZMIN database (Geoscience Australia, 2013), information current as of December 2012
1.5.1.1.1 Water accounts in the Richmond river basin
With only two main water storages (Toonumbar Dam and Rocky Lake) and a few weirs, flows in the Richmond River are largely unregulated. Storage volumes are summarised in Table 3 and Table 4. The mean daily volume (2004–05 to 2011–12) was 10.59 GL (range 7.29 to 14.05 GL) in Toonumbar Dam. The mean daily volume (2008–09 to 2011–12) was 13.85 GL (range 9.11 to 15.52 GL) in Rocky Lake. The combined mean daily storage was 24.44 GL.
Inflows to the Toonumbar Dam are ungauged but flows are measured below the dam at Iron Pot Creek at Toonumbar (203023). Losses from the Toonumbar Dam storage occur through continual controlled stream releases to supply downstream irrigation and flood releases when storage capacity is exceeded. Mean flows at Iron Pot Creek at Toonumbar were 36.9 GL/year (range4.1–83.5 GL/year). Other sources of outflow such as evapotranspiration from the reservoir surface also account for losses from the storage.
Table 3 Storage volumes at the start (July) of the water year, inflows and outflows for Toonumbar Dam (11 GL capacity excluding flood storage) in the Richmond river basin
Data: Outflow volumes for Toonumbar Dam were obtained from NSW Office of Water (2015). Volumes were obtained from the Bureau of Meteorology (Dataset 1)
Table 4 Storage volumes at the start (July) of the water year for Rocky Lake (14 GL capacity excluding flood storage) in the Richmond river basin
NA = data not available
Data: Volumes were obtained from the Bureau of Meteorology (Dataset 1)
Surface water licences and entitlements
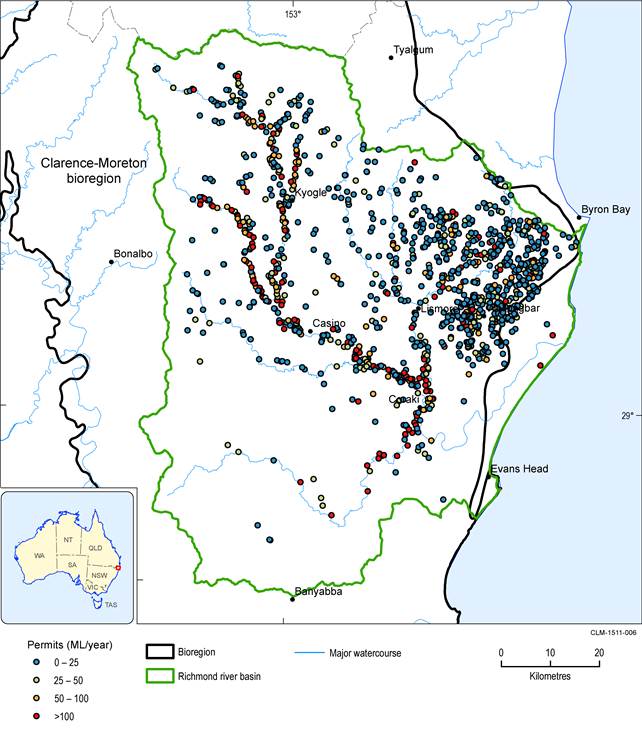
In the Richmond river basin, licences amount to 99,881 ML/year. Table 5 summarises surface water licences by purpose and Table 6 by type and water source (definitions of some terms are given in Table 8 of Section 1.5.1.2). Figure 4 shows the geographic distribution and extraction volumes for each licence.
Table 5 Licences grouped by purpose in the Richmond river basin
Data: NSW Office of Water (Dataset 2)
Table 6 Licences grouped by river or creek in the Richmond river basin
Water access right refers to the right conferred by law to hold or take water from a water resource.
Data: NSW Office of Water(Dataset 2)
Data: NSW Office of Water (Dataset 2)
1.5.1.1.2 Gaps
There are several unknown water sources and volumes including:
- ungauged tributary inflow
- ungauged runoff
- surface water - groundwater interactions.
Some of the sources not included here are implicitly considered, for example, reservoir rainfall and evaporation would be reflected in changes in the storage volume.
References
Geoscience Australia (2013) OZMIN Mineral Deposits Database, Canberra.
NSW Office of Water (2015) Continuous monitoring network. New South Wales Office of Water. Viewed 17 March 2015, http://realtimedata.water.nsw.gov.au/water.stm.
Rassam D, Raiber M, McJannet D, Janardhanan S, Murray J, Gilfedder M, Cui T, Matveev V, Doody T, Hodgen M and Ahmad ME (2014) Context statement for the Clarence-Moreton bioregion. Product 1.1 from the Clarence-Moreton Bioregional Assessment. Department of the Environment, Bureau of Meteorology, CSIRO and Geoscience Australia, Australia. Viewed 29 April 2015, http://data.bioregionalassessments.gov.au/product/CLM/CLM/1.1.
Datasets
Dataset 1 Bureau of Meteorology (2015) Water levels Selected Dam Storages Time Series NSW BOM CLM 20150327. Bioregional Assessment Source Dataset. Viewed 10 April 2015, https://data.bioregionalassessments.gov.au/datastore/dataset/327a70dd-6498-4c8f-9308-bc4a366b66ad.
Dataset 2 NSW Office of Water (2013) Surface Water Offtakes processed for Clarence Moreton v3 12032014. Bioregional Assessment Source Dataset. Viewed 10 April 2015, https://data.bioregionalassessments.gov.au/datastore/dataset/715a405b-dc50-46ca-9704-1f698e5b66fc.
