The impact and risk analysis (Box 6) used multiple lines of evidence to investigate how hydrological changes due to additional coal resource development may affect ecosystems in the assessment extent.
Six landscape groups represent these ecosystems (Box 7; Table 1 in Section 2.3.3 in Herr et al. (2018b)):
- ‘Floodplain or lowland riverine’
- ‘Non-floodplain or upland riverine’
- ‘Dryland remnant vegetation’
- ‘Rainforest’
- ‘Human-modified’
- ‘Springs’.
Potential impacts on ecosystems were assessed by overlaying their extent on the zone of potential hydrological change (Box 4).
For potentially impacted ecosystems within the zone, receptor impact models (Box 8) were used to translate predicted changes in hydrology into a distribution of ecological outcomes that may arise from those changes. These models used indicators of the health of the ecosystem, such as the presence of tadpoles, to infer the potential ecological impacts of hydrological changes.
The relative risk to ecosystems is reported using categories defined in Box 9.
More detail on each ecosystem, including information on water dependency, sensitivity to change and potential ecosystem relevance of hydrological changes, is contained in Section 3.4 of the impact and risk analysis (Herr et al., 2018a).
Potential impacts to water-dependent ecosystems and assets were assessed by multiple lines of evidence that included: Impacts to all assets and ecosystems were assessed (as a minimum) by overlaying the extent of ecosystems and assets on the zone in order to identify the hydrological changes that a particular asset or ecosystem might experience. For ecological assets, the assessment considered the potential impact to the habitat of species, not to the species themselves. Ecosystems and assets that fall within the mine pit exclusion zone are likely to be impacted, but as estimates of drawdown are unreliable, quantification of the impact is not possible. Similarly, surface water modelling near mine pits cannot quantify the impact on some streams. Box 6 Analysing impact and risk
Box 7 Understanding the landscape classification
Twenty-nine landscape classes represent the natural and human-modified ecosystems in the Namoi subregion (Figure 24 and Table 16 in Herr et al. (2018a)). They enable a systematic and comprehensive analysis of potential impacts on, and risks to, the water-dependent assets nominated by the community. The landscape classification was based on the subregion’s geology, geomorphology, hydrogeology, land use and ecology. These landscape classes were aggregated into six landscape groups, based on their likely response to hydrological changes. Definitions for landscape classes and landscape groups for the Namoi subregion are available online at environment.data.gov.au/def/ba/landscape-classification/namoi-subregion.
Ecosystems
Which ecosystems are very unlikely to be impacted?
Potential impacts due to additional coal resource development are very unlikely for 20 springs in the assessment extent that are outside the zone of potential hydrological change. Two springs, on the eastern fringes of the Great Artesian Basin within the zone, may experience an unquantified impact. Further local-scale investigations are required to determine the magnitude of any potential impacts. Key finding 6
Of the 15 non-GAB springs found in the assessment extent, none occur within the zone of potential hydrological change (Box 4). Therefore, impacts on these ecosystems can be ruled out as they are very unlikely to experience hydrological changes due to additional coal resource development since it is assumed that the regional watertable is the source of these springs. Five of the seven GAB springs are outside the area where there may be additional groundwater drawdown in the GAB. The two remaining springs in the zone need further investigation to determine their connection to the GAB, as discussed further in ‘Great Artesian Basin springs’.
Ecosystems where potential impacts were ruled out include:
- dryland remnant vegetation, because this comprises vegetation communities that are deemed to not be dependent on surface water or groundwater for the purposes of this bioregional assessment
- human-modified ecosystems, because these primarily comprise agricultural and urban ecosystems that are highly modified by human activity (some aspects are covered in potential impacts on economic assets)
- rainforests, because the 4.4 km2 area that they occupy in the zone relies on groundwater systems that are unlikely to be impacted due to additional coal resource development (Section 3.4.6 of Herr et al. (2018a)).
Which ecosystems are potentially impacted?
The ‘Floodplain or lowland riverine’, ‘Non-floodplain or upland riverine’, and ‘Springs’ landscape groups, and their respective landscape classes that intersect the 7014 km2 zone, are considered dependent on groundwater or surface water and potentially impacted due to additional coal resource development. This includes an area of 1415 km2 (Table 1).
Receptor impact models (Box 8) identified areas at greater relative risk (Box 9) for potentially impacted floodplain and lowland riverine ecosystems; non-floodplain and upland riverine ecosystems; and upland and lowland Pilliga riverine ecosystems. The receptor impact models developed for these three ecosystems rely on the same hydrological response variables: changes in overbank flooding and in cease-to-flow attributes (such as zero-flow days and zero-flow spells; see Section 3.4 of Herr et al. (2018a)). Thus the potential ecological relevance of these hydrological changes is the same for the three ecosystems (Section 2.7.3 in Ickowicz et al. (2018)), for example:
- Overbank flooding maintains the health of floodplain vegetation through provision of freshwater, leaching of soil salinity and regeneration of floodplain species. Therefore, fewer overbank events limit nutrient supply and essential wetland habitat for frogs and fish in riverine ecosystems.
- More zero-flow days and zero-flow spells are likely to put additional stress on in-stream organisms in times when their survival depends on isolated pools or the water level and quality of the hyporheic zone.
- Greater groundwater drawdown may reduce baseflow contributions and increase intermittency in streams, and may make access to water more difficult for floodplain and riparian vegetation.
Floodplain and lowland riverine ecosystems
Relative to the entire assessment extent, 34% of the area and 38% of the stream length of floodplain and lowland ecosystems are in the zone of potential hydrological change (Figure 14).
Some areas of floodplain or lowland riverine ecosystems – including those near Maules, Back and Bollol creeks and adjacent parts of the Namoi River, all near additional coal resource developments – are ‘more at risk of ecological and hydrological changes’ due to additional coal resource development than other areas in the assessment extent. Key finding 7
Parts of these ecosystems are ‘more at risk of ecological and hydrological changes’ due to potential alterations in the hydrological regime. For example, about 17 km of permanent lowland stream ecosystems have a 50% chance of an additional 20 zero-flow days (averaged over 30 years) and an increase of more than 10 days in maximum zero-flow spells over the short-term period (2013 to 2042) (Section 3.4.3 in Herr et al. (2018a)). There are 10 km of temporary lowland stream ecosystems that are exposed to a similar magnitude of changes (Section 3.4.3 in Herr et al. (2018a)).
About 0.5 km2 of the riparian vegetation of these lowland riverine ecosystems has a 50% chance of a decrease of at least one overbank event per 20 years during the short-term period (2013 to 2042) (Section 3.4.3 in Herr et al. (2018a)). There is also a 50% chance of greater than 2 m groundwater drawdown for an area of 0.6 km2 due to additional coal resource development (Section 3.4.3 in Herr et al. (2018a)).
An area of 7.7 km2 of floodplain wetland ecosystems and an area of 19.7 km2 of floodplain wetland groundwater-dependent ecosystems have a 5% chance of experiencing a decline of at least one overbank flow every 50 years during the 2013 to 2042 short-term period (Section 3.4.3 in Herr et al. (2018a)).
Non-floodplain and upland riverine ecosystems
Approximately 1% of the area and 16% of the stream length of the zone of potential hydrological change are occupied by non-floodplain and upland riverine ecosystems. Approximately 5 km of stream length of upland riverine ecosystems have a 50% chance of increases in zero-flow days (averaged over 30 years) greater than 20 days for both simulation periods (2013 to 2042 and 2073 to 2102, see Section 3.4.3 in Herr et al. (2018a)). A similar length of streams among the upland riverine ecosystems has a 50% chance of annual maximum zero-flow spells, increasing to greater than 10 days in both simulation periods.
A 4 km2 area on or adjacent to Maules Creek is ‘more at risk of ecological and hydrological changes’ (Figure 36 in Section 3.4.4 in Herr et al. (2018a)); this area may require further investigation with local analyses and monitoring.
Upland and lowland Pilliga riverine ecosystems
Receptor impact modelling considered the Pilliga region as a separate entity due to its distinctive biophysical attributes. Temporary upland stream ecosystems in this subregion have 14.8 km exposed to a 50% chance of greater than 2 m drawdown due to additional coal resource development. Surface water modelling predicted that increases in zero-flow days (averaged over 30 years) and length of longest maximum zero-flow spells are not likely in the zone of potential hydrological change within the Pilliga, with only 0.3 km of stream with a 5% chance of greater than 20 additional zero-flow days (averaged over 30 years) in 2013 to 2042 and a similar length with a 5% chance of increases in the length of longest low-flow spells of greater than 3 days. However, the assessment of changes in surface water is limited as the Pilliga region has relatively few model nodes along the stream network, with only two nodes along Bohena Creek. A large proportion (94%) of the entire length of the Pilliga stream network was not quantified in the surface water model used here. Predicted declines were confined to the assessment units along Bohena Creek.
Several locations on or near Bohena Creek are ‘at some risk of ecological and hydrological changes’ (Figure 40 in Section 3.4.4 in Herr et al. (2018a)).
Grassy woodland groundwater-dependent ecosystems
The ‘Grassy woodland GDE’ landscape class within the zone of potential hydrological change comprises most of the non-riverine landscapes in the Pilliga region (561.7 km2), and only a small portion (72.8 km2) of the total 634.7 km2 of this landscape class is located outside of the Pilliga region. The qualitative model indicates that this ecosystem is potentially sensitive to changes in groundwater, and the groundwater modelling indicates that 13.9 km2 of this landscape class are exposed to a 50% chance of greater than 2 m drawdown due to additional coal resource development. This drawdown may reduce the water availability and in turn cause water stress to and decline in groundwater-dependent vegetation during dry periods. However, the experts expressed some uncertainty around the likelihood of groundwater dependency in some of the vegetation types classified as ‘Grassy woodland GDE’, thus a receptor impact model was not built to quantify potential ecosystem impacts (Section 3.4.6 of Herr et al. (2018a)).
Great Artesian Basin springs
Two of seven GAB springs are located on the eastern edge of the Pilliga region, within the zone of potential hydrological change (Figure 14). It is unclear whether these springs source their water from the regional watertable used to define the zone, so it is not known whether they are potentially impacted. The classification as GAB springs is based on their association with underlying sandstone formations; their connection to the GAB requires further investigation. Find out more in Section 3.4.6 of the impact and risk analysis (Herr et al., 2018a).
Table 1 Extent of each landscape group in the assessment extent and the zone of potential hydrological change
aDefinitions for landscape classes and landscape groups for the Namoi subregion are available online at environment.data.gov.au/def/ba/landscape-classification/namoi-subregion.
Data: Bioregional Assessment Programme (Dataset 1)
Receptor impact models translate predicted changes in hydrology into ecological outcomes that may arise from those changes. Applying receptor impact models across ecosystems allows a better understanding of how changed hydrological conditions may impact water-dependent assets within those ecosystems at specified points in time. To assess potential ecological outcomes: For each indicator, experts also identified one or more hydrological response variables, chosen because the indicator is sensitive to changes in those hydrological response variables. The changes in the indicator reflect the magnitude of potential ecological impacts for that ecosystem. Short-term (2013 to 2042) and long-term (2073 to 2102) periods were assessed. Box 8 Receptor impact models
Box 9 Categorising risk for ecosystems
Parts of some ecosystems were deemed at greater risk of ecological and hydrological changes relative to other parts of that ecosystem. Three categories were defined: ‘more at risk of ecological and hydrological changes’, ‘at some risk of ecological and hydrological changes’ and ‘at minimal risk of ecological and hydrological changes’. Categorisation assists the rule-out process and in identifying where further local-scale assessment is warranted.
Assessment units that overlap with a landscape group or class are categorised based on the degree that modelled ecological changes exceed thresholds of risk. These subregion-specific thresholds are based on expert opinion and defined using receptor impact variables listed in Box 8 (see Section 3.4 of Herr et al. (2018a) for more details on the thresholds).
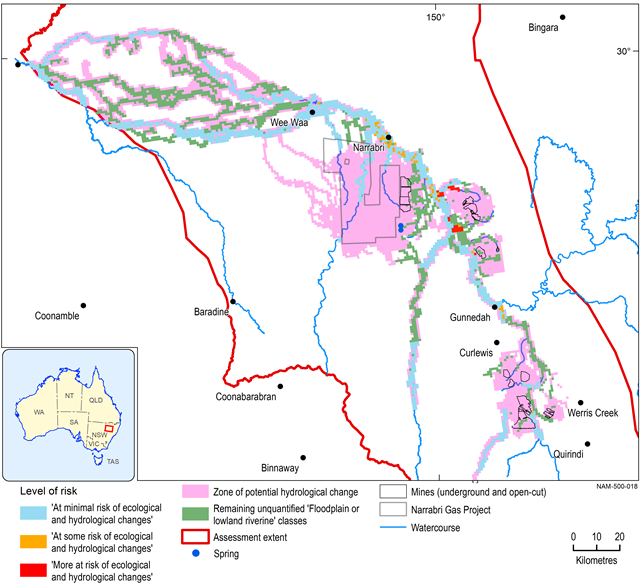
Figure 14 Composite risk map for the 'Floodplain or lowland riverine' landscape group
Assessment units in the ‘Floodplain or lowland riverine’ landscape group are coloured according to their risk of ecological and hydrological changes relative to other assessment units in that landscape group. Three risk categories (defined in Box 9) are shown on this map: ‘at minimal risk of ecological and hydrological changes’ (blue); ‘at some risk of ecological and hydrological changes’ (orange); and ‘more at risk of ecological and hydrological changes’ (red). Assessment units without receptor impact modelling and surface water modelling are shown in green. Two springs within the zone are shown.
Data: Bioregional Assessment Programme (Dataset 1)
Explore potential impacts on ecosystems in more detail on the BA Explorer, available at www.bioregionalassessments.gov.au/explorer/NAM/landscapes. Conceptual modelling, product 2.3 (Herr et al., 2018b) Receptor impact modelling, product 2.7 (Ickowicz et al., 2018) Impact and risk analysis, product 3-4 (Herr et al., 2018a) Assigning receptors to water-dependent assets, submethodology M03 (O’Grady et al., 2016) Receptor impact modelling, submethodology M08 (Hosack et al., 2018) Impacts and risks, submethodology M10 (Henderson et al., 2018) Landscape classification (Dataset 9) Impact and risk analysis database (Dataset 1) Receptor impact model (Dataset 10) Results from applying receptor impact models (Dataset 11) FIND MORE INFORMATION
