Histograms of the 5th, 50th and 95th percentile of (a) additional drawdown at the regional...
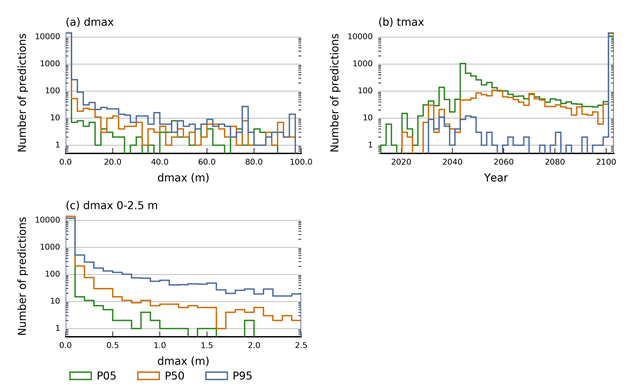
Figure 30 Histograms of the 5th, 50th and 95th percentile of (a) additional drawdown at the regional watertable and (b) year of maximum change; plot (c) shows the additional drawdown in the range from 0 m to 2.5 m
Figure 30 Histograms of the 5th, 50th and 95th percentile of (a) additional drawdown at the regional watertable and (b) year of maximum change; plot (c) shows the additional drawdown in the range from 0 m to 2.5 m
Histograms of the 5th, 50th and 95th percentile of (a) additional drawdown at the regional...
Figure 30 Histograms of the 5th, 50th and 95th percentile of (a) additional drawdown at the regional watertable and (b) year of maximum change; plot (c) shows the additional drawdown in the range from 0 m to 2.5 m
Data register
This page lists all of the datasets and subsets used by the figure shown within the product section or submethodology section named below.
The data links listed on this page connect to the relevant landing page on the information service data.gov.au. From this external site publically available datasets may be downloaded.
This information is provided to enable the identification, review and understanding of the datasets used in the bioregional assessments and their origins. This list of datasets enhances the transparency of the science by the Bioregional Assessments Programme.