(Top row) Predicted mean (black dot or line) and 80% central credible interval (grey line or polygon...
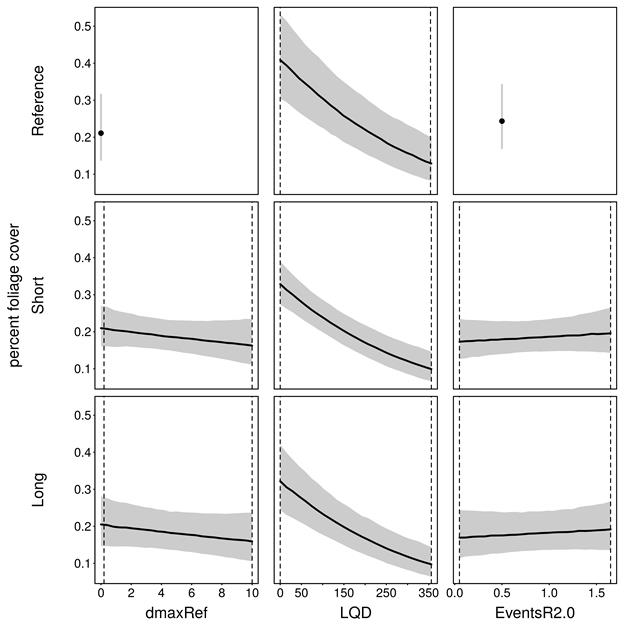
(Top row) Predicted mean (black dot or line) and 80% central credible interval (grey line or polygon) of percent foliage cover under reference hydrological conditions. (Middle and bottom rows) Predicted future effects (mean = black line, 80% central ...
(Top row) Predicted mean (black dot or line) and 80% central credible interval (grey line or polygon) of percent foliage cover under reference hydrological conditions. (Middle and bottom rows) Predicted future effects (mean = black line, 80% central ...
(Top row) Predicted mean (black dot or line) and 80% central credible interval (grey line or polygon...
(Top row) Predicted mean (black dot or line) and 80% central credible interval (grey line or polygon) of percent foliage cover under reference hydrological conditions. (Middle and bottom rows) Predicted future effects (mean = black line, 80% central ...
Data register
This page lists all of the datasets and subsets used by the figure shown within the product section or submethodology section named below.
The data links listed on this page connect to the relevant landing page on the information service data.gov.au. From this external site publically available datasets may be downloaded.
This information is provided to enable the identification, review and understanding of the datasets used in the bioregional assessments and their origins. This list of datasets enhances the transparency of the science by the Bioregional Assessments Programme.